Part4_Chapter 1_Low Vol Roads
Part4_Chapter 1_Low Vol Roads
Part4_Chapter 1_Low Vol Roads
标准信息
STANDARD INFORMATION- 标准编号
- Part4_Chapter 1_Low Vol Roads
- 所属分类
- 其他国外标准与工程资料
- 文件语言
- 英语
- 文件格式
- 文件页数
- 6 页
- 文件大小
- 377.98 KB
· 更新:
标准简介
OVERVIEW中文简介
标准 Part4_Chapter 1_Low Vol Roads 的预览内容
English summary
Preview of standard Part4_Chapter 1_Low Vol Roads
以上为根据文件整理的内容简介。
标准内容预览
DOCUMENT PREVIEWTable 4.1.3. Example of flexible pavement design catalog for low volume roads—recommended HMAC thicknesses for three levels of trucks/bus traffic, five levels of subgrade soil quality, two levels of aggregate bases, two levels of subgrade improvements, and two climatic zones at 50 percent reliability.*
| Design Reliability: 50 percent | ||||||||
|---|---|---|---|---|---|---|---|---|
| Climatic Region | Chicago (freeze) | Atlanta (non-freeze) | ||||||
| Frost Penetration into Subgrade and Frost Classification of Soil (For non-frost susceptible soils, use the non-freeze climate cells.) | Yes. Soils Subject to Freeze-Thaw Weakening | No All Soils. | ||||||
| Stabilized Subgrade or Improved Foundation Layer | No | Yes | No | Yes | ||||
| Type of Aggregate Base Material | Crushed Stone | Pit Run | Crushed Stone | Pit Run | Crushed Stone | Pit Run | Crushed Stone | Pit Run |
| Relative Quality of Subgrade Soil | Low Traffic: 50,000 Trucks/Buses | |||||||
| Very good | 2-6 | 2-6 | NA | NA | 2-6 | 2-6 | NA | NA |
| Good | 2-6 | 2-6 | NA | NA | 2-6 | 2-6 | NA | NA |
| Fair | 2-8 | 2-8 | NA | NA | 2-8 | 2-8 | NA | NA |
| Poor | 2-8 | 2-8 | 2-6 | 2-6 | 2-8 | 2-8 | 2-6 | 2-6 |
| Very poor | 3 ½-8 | 3 ½-8 | 2-6 | 2-6 | 2-8 | 2 ½-8 | 2-6 | 2-6 |
| Medium Traffic: 250,000 Trucks/Buses | ||||||||
| Very good | 2-6 | 2 ½-6 | NA | NA | 2-6 | 2 ½-6 | NA | NA |
| Good | 2-6 | 2 ½-6 | NA | NA | 2-6 | 2 ½-6 | NA | NA |
| Fair | 2 ½-8 | 3 ½-8 | NA | NA | 2-8 | 2 ½-8 | NA | NA |
| Poor | 3 ½-8 | 4-8 | 2-6 | 2 ½-6 | 2 ½-8 | 3-8 | 2-6 | 2 ½-6 |
| Very poor | 4 ½-9 | 5-9 | 2 ½-6 | 3-6 | 3 ½-9 | 4 ½-9 | 2 ½-6 | 3-6 |
| High Traffic: 750,000 Trucks/Buses | ||||||||
| Very good | 3 ½-6 | 4-6 | NA | NA | 3 ½-6 | 4-6 | NA | NA |
| Good | 3 ½-6 | 4-6 | NA | NA | 3 ½-6 | 4-6 | NA | NA |
| Fair | 4-8 | 5-8 | 3 ½-6 | 4-6 | 3 ½-8 | 4 ½-8 | 3 ½-6 | 4-6 |
| Poor | 5-8 | 5 ½-8 | 3 ½-6 | 4 ½-6 | 4-8 | 4 ½-8 | 3 ½-6 | 4 ½-6 |
| Very poor | 6-10 | 6 ½-10 | 4-6 | 4 ½-6 | 5-10 | 6-10 | 4-6 | 4 ½-6 |
* Notes:
- These designs have met the performance criteria in table 4.1.2 for smoothness, fatigue cracking, and rutting.
- The values provided in the cells above represent the thickness of the HMA layer and aggregate base layer.
- The above designs include the effects of moisture changes, frost, and freeze-thaw cycling on performance, however, the design does not consider directly the prevention of frost heaving or swelling soils. This should be considered separately for local areas if desired.
- Designs based on the asphalt binder in the HMA wearing surface meeting the P-G binder specification.
- The thickness of the improved subgrade layer was assumed to be 8 inches, and the modulus of the improved subgrade was assumed to be about 2 times greater than the modulus of the subgrade soil selected for design.
- For drier climates than those identified above, use the layer thickness and flexible pavement cross section for the wet climates. If a more precise solution is desired, use the program to calculate the layer thickness requirements.
6
ACKNOWLEDGMENT OF SPONSORSHIP
This work was sponsored by the American Association of State Highway and Transportation Officials, in cooperation with the Federal Highway Administration, and was conducted in the National Cooperative Highway Research Program, which is administered by the Transportation Research Board of the National Research Council.
DISCLAIMER
This is the final draft as submitted by the research agency. The opinions and conclusions expressed or implied in the report are those of the research agency. They are not necessarily those of the Transportation Research Board, the National Research Council, the Federal Highway Administration, the American Association of State Highway and Transportation Officials, or the individual states participating in the National Cooperative Highway Research Program.
2
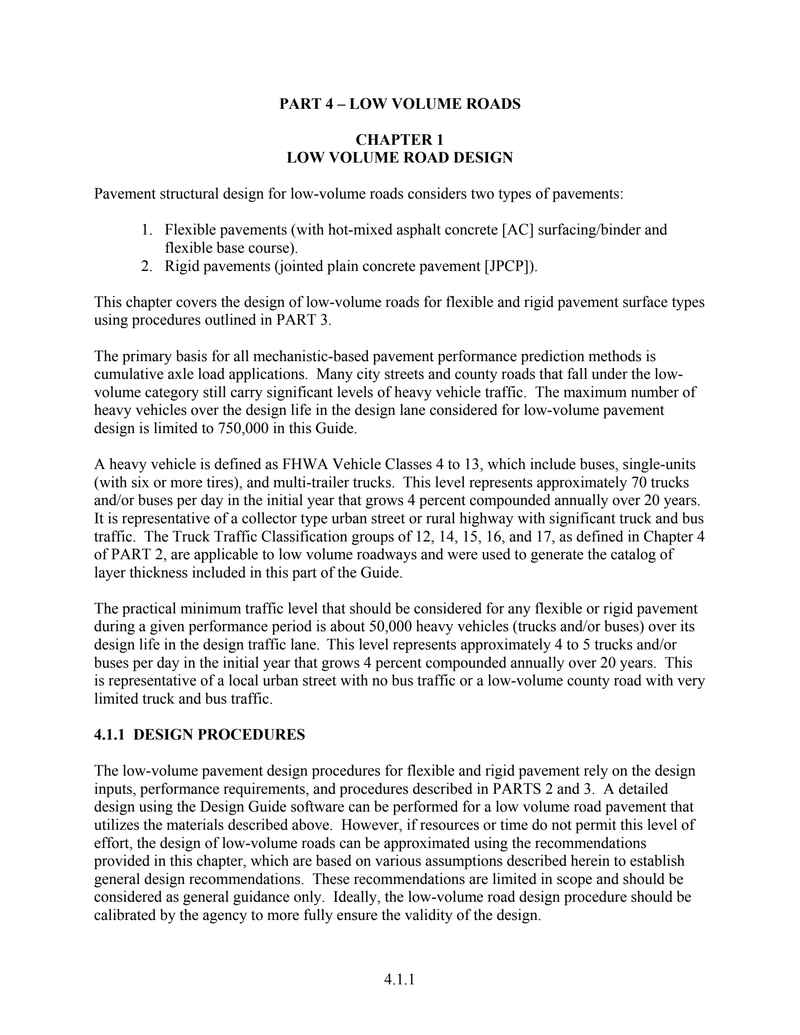
PART 4 – LOW VOLUME ROADS
CHAPTER 1
LOW VOLUME ROAD DESIGN
Pavement structural design for low-volume roads considers two types of pavements:
- Flexible pavements (with hot-mixed asphalt concrete [AC] surfacing/binder and flexible base course).
- Rigid pavements (jointed plain concrete pavement [JPCP]).
This chapter covers the design of low-volume roads for flexible and rigid pavement surface types using procedures outlined in PART 3.
The primary basis for all mechanistic-based pavement performance prediction methods is cumulative axle load applications. Many city streets and county roads that fall under the low-volume category still carry significant levels of heavy vehicle traffic. The maximum number of heavy vehicles over the design life in the design lane considered for low-volume pavement design is limited to 750,000 in this Guide.
A heavy vehicle is defined as FHWA Vehicle Classes 4 to 13, which include buses, single-units (with six or more tires), and multi-trailer trucks. This level represents approximately 70 trucks and/or buses per day in the initial year that grows 4 percent compounded annually over 20 years. It is representative of a collector type urban street or rural highway with significant truck and bus traffic. The Truck Traffic Classification groups of 12, 14, 15, 16, and 17, as defined in Chapter 4 of PART 2, are applicable to low volume roadways and were used to generate the catalog of layer thickness included in this part of the Guide.
The practical minimum traffic level that should be considered for any flexible or rigid pavement during a given performance period is about 50,000 heavy vehicles (trucks and/or buses) over its design life in the design traffic lane. This level represents approximately 4 to 5 trucks and/or buses per day in the initial year that grows 4 percent compounded annually over 20 years. This is representative of a local urban street with no bus traffic or a low-volume county road with very limited truck and bus traffic.
4.1.1 DESIGN PROCEDURES
The low-volume pavement design procedures for flexible and rigid pavement rely on the design inputs, performance requirements, and procedures described in PARTS 2 and 3. A detailed design using the Design Guide software can be performed for a low volume road pavement that utilizes the materials described above. However, if resources or time do not permit this level of effort, the design of low-volume roads can be approximated using the recommendations provided in this chapter, which are based on various assumptions described herein to establish general design recommendations. These recommendations are limited in scope and should be considered as general guidance only. Ideally, the low-volume road design procedure should be calibrated by the agency to more fully ensure the validity of the design.
3
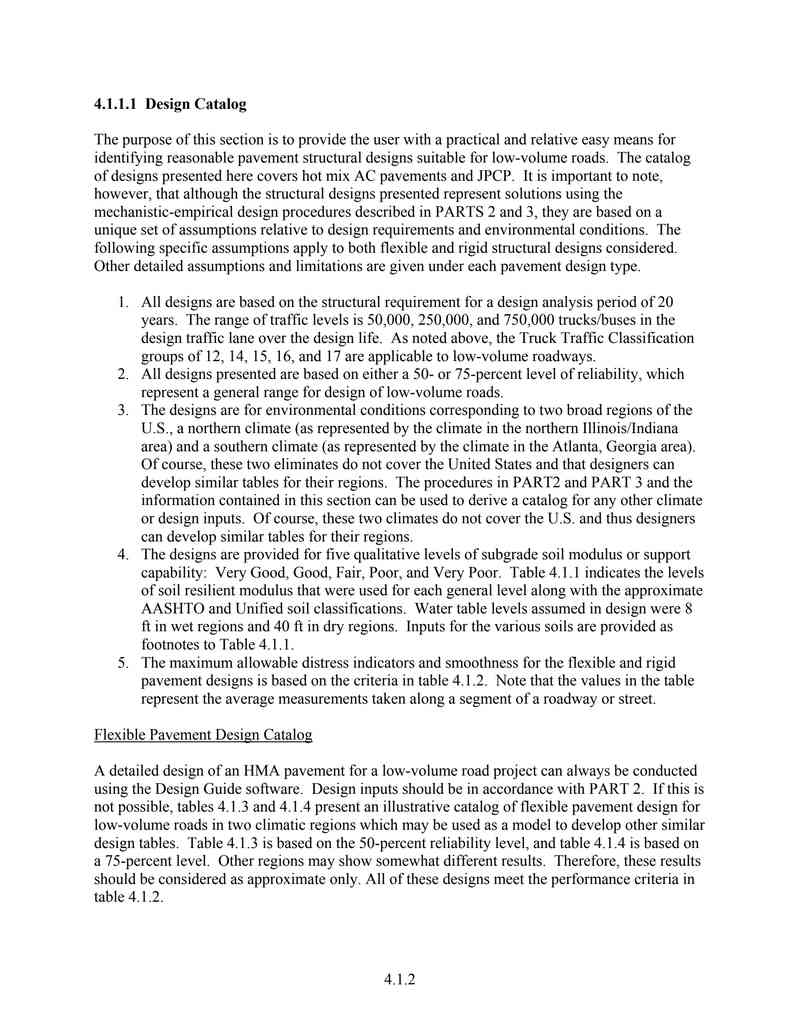
4.1.1.1 Design Catalog
The purpose of this section is to provide the user with a practical and relative easy means for identifying reasonable pavement structural designs suitable for low-volume roads. The catalog of designs presented here covers hot mix AC pavements and JPCP. It is important to note, however, that although the structural designs presented represent solutions using the mechanistic-empirical design procedures described in PARTS 2 and 3, they are based on a unique set of assumptions relative to design requirements and environmental conditions. The following specific assumptions apply to both flexible and rigid structural designs considered. Other detailed assumptions and limitations are given under each pavement design type.
- All designs are based on the structural requirement for a design analysis period of 20 years. The range of traffic levels is 50,000, 250,000, and 750,000 trucks/buses in the design traffic lane over the design life. As noted above, the Truck Traffic Classification groups of 12, 14, 15, 16, and 17 are applicable to low-volume roadways.
- All designs presented are based on either a 50- or 75-percent level of reliability, which represent a general range for design of low-volume roads.
- The designs are for environmental conditions corresponding to two broad regions of the U.S., a northern climate (as represented by the climate in the northern Illinois/Indiana area) and a southern climate (as represented by the climate in the Atlanta, Georgia area). Of course, these two eliminates do not cover the United States and that designers can develop similar tables for their regions. The procedures in PART2 and PART 3 and the information contained in this section can be used to derive a catalog for any other climate or design inputs. Of course, these two climates do not cover the U.S. and thus designers can develop similar tables for their regions.
- The designs are provided for five qualitative levels of subgrade soil modulus or support capability: Very Good, Good, Fair, Poor, and Very Poor. Table 4.1.1 indicates the levels of soil resilient modulus that were used for each general level along with the approximate AASHTO and Unified soil classifications. Water table levels assumed in design were 8 ft in wet regions and 40 ft in dry regions. Inputs for the various soils are provided as footnotes to Table 4.1.1.
- The maximum allowable distress indicators and smoothness for the flexible and rigid pavement designs is based on the criteria in table 4.1.2. Note that the values in the table represent the average measurements taken along a segment of a roadway or street.
Flexible Pavement Design Catalog
A detailed design of an HMA pavement for a low-volume road project can always be conducted using the Design Guide software. Design inputs should be in accordance with PART 2. If this is not possible, tables 4.1.3 and 4.1.4 present an illustrative catalog of flexible pavement design for low-volume roads in two climatic regions which may be used as a model to develop other similar design tables. Table 4.1.3 is based on the 50-percent reliability level, and table 4.1.4 is based on a 75-percent level. Other regions may show somewhat different results. Therefore, these results should be considered as approximate only. All of these designs meet the performance criteria in table 4.1.2.
4
| General Level of Subgrade Support | AASHTO and Unified Soil Classification | Broad Mr Range and Mean Mr at Optimum Moisture Content |
|---|---|---|
| Very Good | Coarse grained: Gravel and gravelly soils A-1-a, A-1-b GW, GP, GM, GW-GM, GP-GC | 25,000 to 45,000 psi Mean = 39,000 psi |
| Good | Coarse grained: Sand and sandy soils A-2-4, A-3 GC, SM, GW-GC, GP-GM, GP-GC | 20,000 to 40,000 psi Mean = 33,000 psi |
| Fair | Fine grained: Mixed silts and clays A-2-7, A4, A-2-5, A-2-6 SC, SP-SM, SP, SW-SM, SP-SC, SW-SC | 15,000 to 30,000 psi Mean = 26,000 psi |
| Poor | Fine grained: Low compressibility A-5, A-6 ML, CL | 10,000 to 25,000 psi Mean = 18,000 psi |
| Very Poor | Fine grained: high compressibility A-7-5, A-7-6 CH, MH | 5,000 to 14,000 psi Mean = 10,000 psi |
Note: Subgrade properties for the above soil classes are as follows:
Very Poor (PI=30, No. 200=85%, No. 4=95%, D60=0.02 mm)
Poor (PI=15, No. 200=75%, No. 4=95%, D60=0.04 mm)
Fair (PI=7, No. 200=30%, No. 4=70%, D60=1.0 mm)
Good (PI=5, No. 200=20%, No. 4=61%, D60=3.0 mm); this would meet most agency material specifications for an aggregate subbase material.
Very Good (PI=1, No. 200=5%, No. 4=47%, D60=8.0 mm); this would be representative of a good quality base material.
| Pavement Type | Performance Indicator | Criteria |
|---|---|---|
| Flexible | Smoothness, IRI* Wheelpath Rutting Fatigue Cracking | 200 in/mile 0.60 in. 45% of wheelpaths |
| Rigid JPCP | Smoothness, IRI* Joint Faulting Slab Cracking | 200 in/mi 0.15 in 45% slabs |
* Initial IRI assumed to be 100 in/mi for urban street construction due to utilities and other constraints.
5
Table 4.1.3. Example of flexible pavement design catalog for low volume roads—recommended HMAC thicknesses for three levels of trucks/bus traffic, five levels of subgrade soil quality, two levels of aggregate bases, two levels of subgrade improvements, and two climatic zones at 50 percent reliability.*
| Design Reliability: 50 percent | ||||||||
|---|---|---|---|---|---|---|---|---|
| Climatic Region | Chicago (freeze) | Atlanta (non-freeze) | ||||||
| Frost Penetration into Subgrade and Frost Classification of Soil (For non-frost susceptible soils, use the non-freeze climate cells.) | Yes. Soils Subject to Freeze-Thaw Weakening | No All Soils. | ||||||
| Stabilized Subgrade or Improved Foundation Layer | No | Yes | No | Yes | ||||
| Type of Aggregate Base Material | Crushed Stone | Pit Run | Crushed Stone | Pit Run | Crushed Stone | Pit Run | Crushed Stone | Pit Run |
| Relative Quality of Subgrade Soil | Low Traffic: 50,000 Trucks/Buses | |||||||
| Very good | 2-6 | 2-6 | NA | NA | 2-6 | 2-6 | NA | NA |
| Good | 2-6 | 2-6 | NA | NA | 2-6 | 2-6 | NA | NA |
| Fair | 2-8 | 2-8 | NA | NA | 2-8 | 2-8 | NA | NA |
| Poor | 2-8 | 2-8 | 2-6 | 2-6 | 2-8 | 2-8 | 2-6 | 2-6 |
| Very poor | 3 ½-8 | 3 ½-8 | 2-6 | 2-6 | 2-8 | 2 ½-8 | 2-6 | 2-6 |
| Medium Traffic: 250,000 Trucks/Buses | ||||||||
| Very good | 2-6 | 2 ½-6 | NA | NA | 2-6 | 2 ½-6 | NA | NA |
| Good | 2-6 | 2 ½-6 | NA | NA | 2-6 | 2 ½-6 | NA | NA |
| Fair | 2 ½-8 | 3 ½-8 | NA | NA | 2-8 | 2 ½-8 | NA | NA |
| Poor | 3 ½-8 | 4-8 | 2-6 | 2 ½-6 | 2 ½-8 | 3-8 | 2-6 | 2 ½-6 |
| Very poor | 4 ½-9 | 5-9 | 2 ½-6 | 3-6 | 3 ½-9 | 4 ½-9 | 2 ½-6 | 3-6 |
| High Traffic: 750,000 Trucks/Buses | ||||||||
| Very good | 3 ½-6 | 4-6 | NA | NA | 3 ½-6 | 4-6 | NA | NA |
| Good | 3 ½-6 | 4-6 | NA | NA | 3 ½-6 | 4-6 | NA | NA |
| Fair | 4-8 | 5-8 | 3 ½-6 | 4-6 | 3 ½-8 | 4 ½-8 | 3 ½-6 | 4-6 |
| Poor | 5-8 | 5 ½-8 | 3 ½-6 | 4 ½-6 | 4-8 | 4 ½-8 | 3 ½-6 | 4 ½-6 |
| Very poor | 6-10 | 6 ½-10 | 4-6 | 4 ½-6 | 5-10 | 6-10 | 4-6 | 4 ½-6 |
* Notes:
- These designs have met the performance criteria in table 4.1.2 for smoothness, fatigue cracking, and rutting.
- The values provided in the cells above represent the thickness of the HMA layer and aggregate base layer.
- The above designs include the effects of moisture changes, frost, and freeze-thaw cycling on performance, however, the design does not consider directly the prevention of frost heaving or swelling soils. This should be considered separately for local areas if desired.
- Designs based on the asphalt binder in the HMA wearing surface meeting the P-G binder specification.
- The thickness of the improved subgrade layer was assumed to be 8 inches, and the modulus of the improved subgrade was assumed to be about 2 times greater than the modulus of the subgrade soil selected for design.
- For drier climates than those identified above, use the layer thickness and flexible pavement cross section for the wet climates. If a more precise solution is desired, use the program to calculate the layer thickness requirements.
6
预览内容由文件识别整理,表格、公式及文字请以原始文件为准。
原文图片预览
PAGE IMAGES
下载标准文件
Part4_Chapter 1_Low Vol Roads
英语 · PDF · 6 页 · 377.98 KB