标准信息
STANDARD INFORMATION- 标准编号
- 服务水平
- 所属分类
- 其他国外标准与工程资料
- 文件语言
- 英语
- 文件格式
- 文件页数
- 6 页
- 文件大小
- 21.85 KB
· 更新:
标准简介
OVERVIEW中文简介
标准 服务水平 的预览内容
English summary
Preview of standard 服务水平
以上为根据文件整理的内容简介。
标准内容预览
DOCUMENT PREVIEWFigure 2-4. Minimum Turning Path for Intercity Bus (BUS-12 [BUS-40]) Design Vehicle
Max. steering angle is 41.9°
CTR = Centerline turning radius at front axle
6
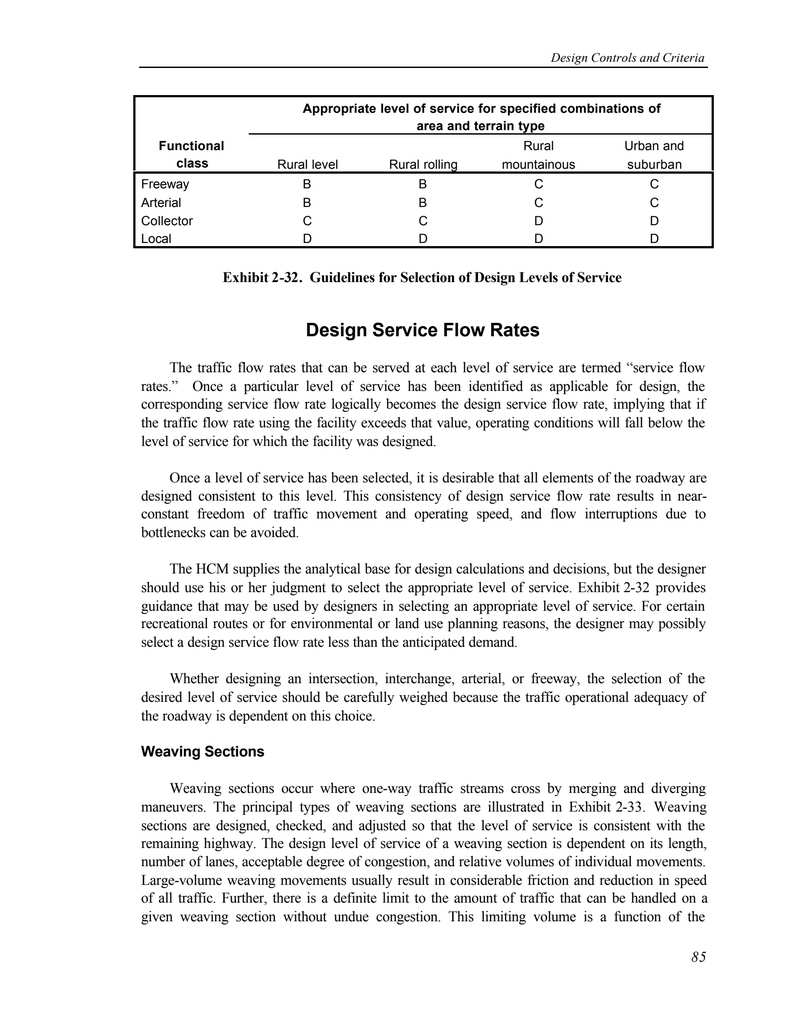
| Functional class | Appropriate level of service for specified combinations of area and terrain type | |||
|---|---|---|---|---|
| Rural level | Rural rolling | Rural mountainous | Urban and suburban | |
| Freeway | B | B | C | C |
| Arterial | B | B | C | C |
| Collector | C | C | D | D |
| Local | D | D | D | D |
Design Service Flow Rates
The traffic flow rates that can be served at each level of service are termed “service flow rates.” Once a particular level of service has been identified as applicable for design, the corresponding service flow rate logically becomes the design service flow rate, implying that if the traffic flow rate using the facility exceeds that value, operating conditions will fall below the level of service for which the facility was designed.
Once a level of service has been selected, it is desirable that all elements of the roadway are designed consistent to this level. This consistency of design service flow rate results in near-constant freedom of traffic movement and operating speed, and flow interruptions due to bottlenecks can be avoided.
The HCM supplies the analytical base for design calculations and decisions, but the designer should use his or her judgment to select the appropriate level of service. Exhibit 2-32 provides guidance that may be used by designers in selecting an appropriate level of service. For certain recreational routes or for environmental or land use planning reasons, the designer may possibly select a design service flow rate less than the anticipated demand.
Whether designing an intersection, interchange, arterial, or freeway, the selection of the desired level of service should be carefully weighed because the traffic operational adequacy of the roadway is dependent on this choice.
Weaving Sections
Weaving sections occur where one-way traffic streams cross by merging and diverging maneuvers. The principal types of weaving sections are illustrated in Exhibit 2-33. Weaving sections are designed, checked, and adjusted so that the level of service is consistent with the remaining highway. The design level of service of a weaving section is dependent on its length, number of lanes, acceptable degree of congestion, and relative volumes of individual movements. Large-volume weaving movements usually result in considerable friction and reduction in speed of all traffic. Further, there is a definite limit to the amount of traffic that can be handled on a given weaving section without undue congestion. This limiting volume is a function of the
2
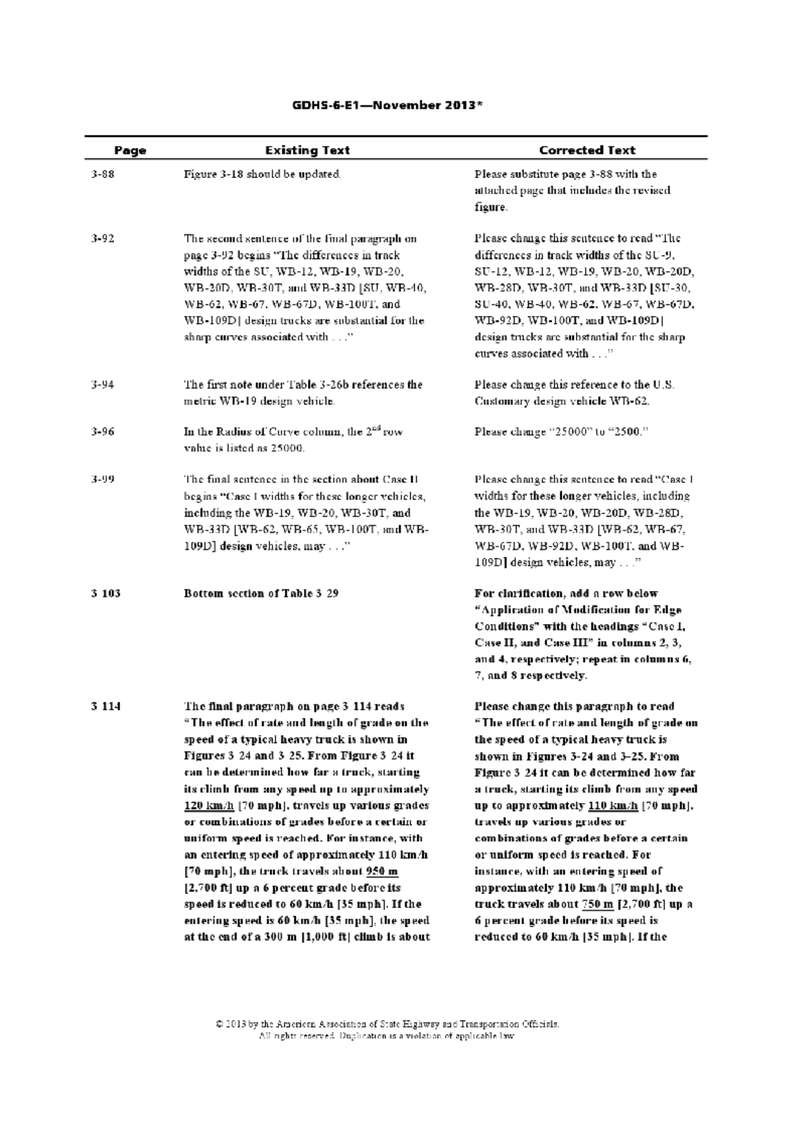
| Page | Existing Text | Corrected Text |
|---|---|---|
| 3-88 | Figure 3-18 should be updated. | Please substitute page 3-88 with the attached page that includes the revised figure. |
| 3-92 | The second sentence of the final paragraph on page 3-92 begins "The differences in track widths of the SU, WB-12, WB-19, WB-20, WB-20D, WB-30T, and WB-33D [SU, WB-40, WB-62, WB-67, WB-67D, WB-100T, and WB-109D] design trucks are substantial for the sharp curves associated with . . ." | Please change this sentence to read "The differences in track widths of the SU-9, SU-12, WB-12, WB-19, WB-20, WB-20D, WB-28D, WB-30T, and WB-33D [SU-30, SU-40, WB-40, WB-62, WB-67, WB-67D, WB-92D, WB-100T, and WB-109D] design trucks are substantial for the sharp curves associated with . . ." |
| 3-94 | The first note under Table 3-26b references the metric WB-19 design vehicle. | Please change this reference to the U.S. Customary design vehicle WB-62. |
| 3-96 | In the Radius of Curve column, the 2nd row value is listed as 25000. | Please change "25000" to "2500." |
| 3-99 | The final sentence in the section about Case II begins "Case I widths for these longer vehicles, including the WB-19, WB-20, WB-30T, and WB-33D [WB-62, WB-65, WB-100T, and WB-109D] design vehicles, may . . ." | Please change this sentence to read "Case I widths for these longer vehicles, including the WB-19, WB-20, WB-20D, WB-28D, WB-30T, and WB-33D [WB-62, WB-67, WB-67D, WB-92D, WB-100T, and WB-109D] design vehicles, may . . ." |
| 3 103 | Bottom section of Table 3 29 | For clarification, add a row below "Application of Modification for Edge Conditions" with the headings "Case I, Case II, and Case III" in columns 2, 3, and 4, respectively; repeat in columns 6, 7, and 8 respectively. |
| 3 114 | The final paragraph on page 3 114 reads "The effect of rate and length of grade on the speed of a typical heavy truck is shown in Figures 3 24 and 3 25. From Figure 3 24 it can be determined how far a truck, starting its climb from any speed up to approximately 120 km/h [70 mph], travels up various grades or combinations of grades before a certain or uniform speed is reached. For instance, with an entering speed of approximately 110 km/h [70 mph], the truck travels about 950 m [2,700 ft] up a 6 percent grade before its speed is reduced to 60 km/h [35 mph]. If the entering speed is 60 km/h [35 mph], the speed at the end of a 300 m [1,000 ft] climb is about | Please change this paragraph to read "The effect of rate and length of grade on the speed of a typical heavy truck is shown in Figures 3-24 and 3-25. From Figure 3 24 it can be determined how far a truck, starting its climb from any speed up to approximately 110 km/h [70 mph], travels up various grades or combinations of grades before a certain or uniform speed is reached. For instance, with an entering speed of approximately 110 km/h [70 mph], the truck travels about 750 m [2,700 ft] up a 6 percent grade before its speed is reduced to 60 km/h [35 mph]. If the |
3
GDHS-6-E1—November 2013*
| Page | Existing Text | Corrected Text |
|---|---|---|
| 43 km/h [26 mph]. This is determined by starting on the curve for a 6 percent grade corresponding to 60 km/h [35 mph] for which the distance is 750 m |
entering speed is 60 km/h [35 mph], the speed at the end of a 300-m |
|
| 3-147 | Equation 3-39 is shown as L = V2 / [254(R ± G)] for the Metric units and as L = V2 / [30(R ± G)] for the U.S. Customary units. |
Please change Equation 3-39 to read L = V2 / [254(R ± G)] for the Metric units and L = V2 / [30(R ± G)] for the U.S. Customary units. |
| Chapter 4 | ||
| 4-2 | Figure 4-1 incorrectly labels the traveled way and the roadway. | Please substitute page 4-2 with the attached page that includes the revised figure. |
| Chapter 5 | ||
| 6-13 | Under Sight Distance, the final subsection of Section 6.3.1, the final sentence references Tables 6-2 and 6-4. | Please change this cross reference to Tables 6-3 and 6-4. |
| Chapter 9 | ||
| 9-12 | The design speeds shown in U.S. Customary units in Figure 9-18 are incorrect. | Please substitute page 9-12 with the attached page that includes the revised figure. |
4
GDHS-6-E1—November 2013*
| Page | Existing Text | Corrected Text |
|---|---|---|
| 9-45 | In the 7th row of Table 9-9 under U.S. Customary units, the Design Speed is listed as 4. | Please change this Design Speed to 45. |
| 9-74 | The dimensions for Diagram B in Figure 9-28 (Metric) are incorrect. | Please substitute page 9-74 with the attached page that includes the revised figure. |
| 9-75 | The dimensions for Diagram B in Figure 9-28 (U.S. Customary) are incorrect. | Please substitute page 9-75 with the attached page that includes the revised figure. |
| Chapter 10 | ||
| 10-78 | In Figure 10-53, Part D2 incorrectly cross references Figure 10-69. | Please change the cross reference to "For Deceleration Length See Table 10-5." |
| 10-93 | Item 1 under Superelevation and cross slope refers to Figures 3-21 through 3-25. | The correct cross reference should be "Tables 3-8 through 3-12." |
| Item 3 refers to Figures 3-29 and 3-30. | Please change these cross references to Tables 3-15 and 3-16, respectively. | |
| 10-108 | Note 2 in Figure 10-69 states, "Point A controls speed on the ramp. Ls should not start back on the curvature of the ramp unless the radius equals 300 m [100 ft] or more." | Please change "100 ft" to "1,000 ft." |
* Items shown in bold are recent additions to the 2012 edition of the GDHS-6 errata.
5
Figure 2-4. Minimum Turning Path for Intercity Bus (BUS-12 [BUS-40]) Design Vehicle
Max. steering angle is 41.9°
CTR = Centerline turning radius at front axle
6
预览内容由文件识别整理,表格、公式及文字请以原始文件为准。
原文图片预览
PAGE IMAGES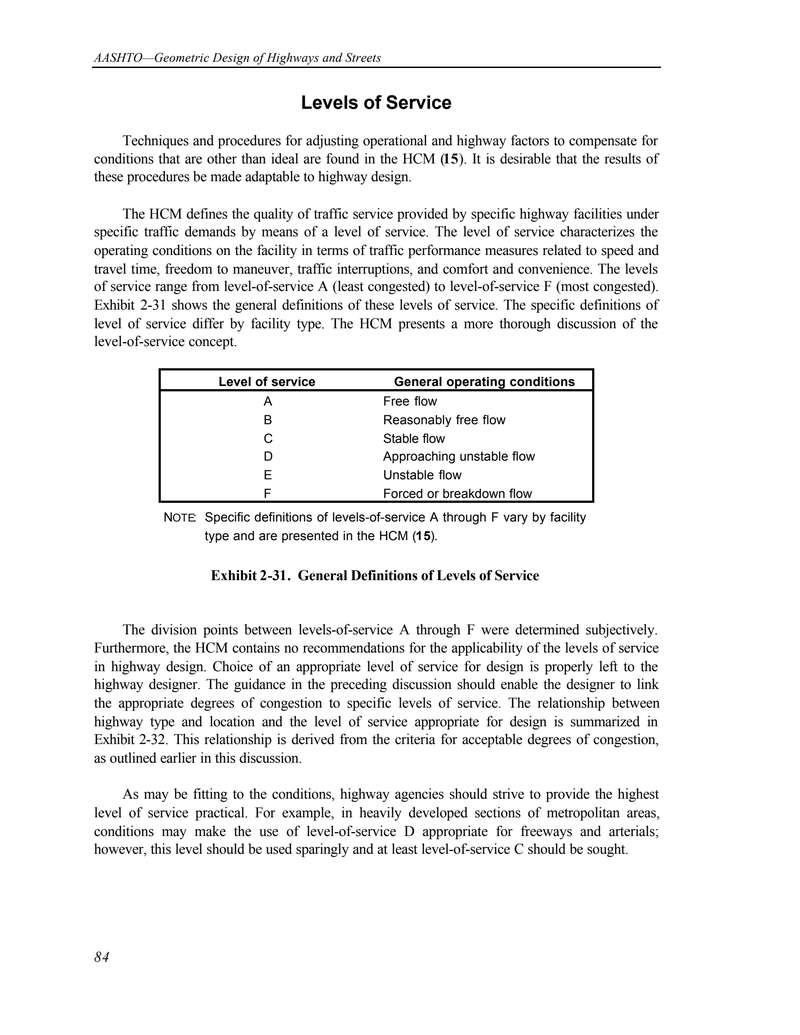

下载标准文件
服务水平
英语 · PDF · 6 页 · 21.85 KB