
标准信息
STANDARD INFORMATION- 标准编号
- 2appendices_OO
- 所属分类
- 其他国外标准与工程资料
- 文件语言
- 英语
- 文件格式
- 文件页数
- 6 页
- 文件大小
- 820.16 KB
· 更新:
标准简介
OVERVIEW中文简介
标准 2appendices_OO 的预览内容
English summary
Preview of standard 2appendices_OO
以上为根据文件整理的内容简介。
标准内容预览
DOCUMENT PREVIEWSlope variance is defined as follows:
SV = (ΣY2 − (1/n)(ΣY)2)/(n − 1) (23)
where
Y = difference between two elevations 9 in. apart
n = number of elevation readings
The accuracy of the models can be judged by the following statistics:
R2 = 84 percent
SEE = 0.38 PSR points
The statistics show that PSR is well correlated with smoothness and distress for flexible pavements. However, smoothness alone accounted for most of the variation observed in serviceability. This is to be expected because distress (medium to high severity, in most cases) on a pavement surface distorts the longitudinal profile of the pavement, which directly affects smoothness.
FHWA Zero-Maintenance Pavements Study(11)
Several research studies have successfully modeled smoothness or serviceability using key pavement distress types for flexible pavements(4, 11, 12, 24)
The following model was developed using data from the AASHO Road Test and relates serviceability to distress.
PSR = 4.5 − 0.49RD − 1.16RDV0.5(1 − 0.087RDV0.5)
− 0.13log(1 + TC) − 0.0344(AC + P)0.5 (24)
R2 = 0.76, SEE = 0.455 points, N = 95
where
RD = rut depth in both wheel paths of the pavement, in
RDV = rut depth variance, in2*100
AC = class 2 or class 3 alligator or fatigue cracking, ft2/1000ft2
TC = transverse and longitudinal cracking, ft2/1000ft2
P = patching, ft2/1000ft2
The model has R2 values comparable to the AASHTO flexible pavement serviceability equation (equation 24). The SEE reported was slightly larger than that of the AASHTO equation. However, it is clear from these models that user-defined serviceability can be predicted
6
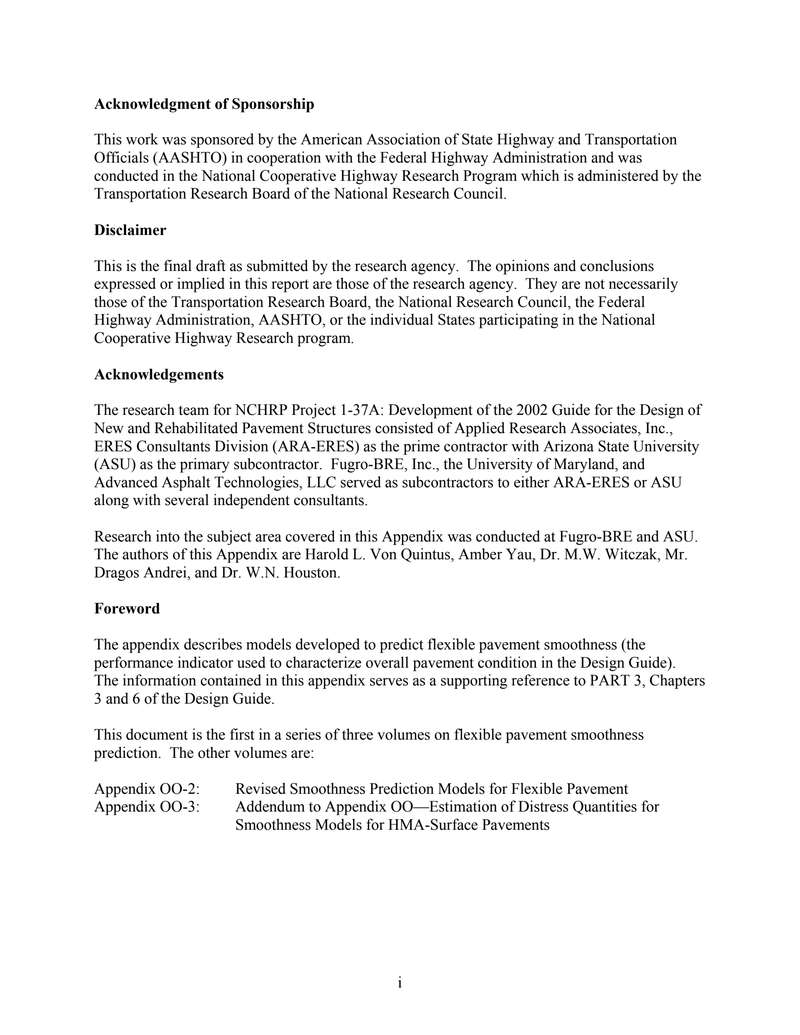
Acknowledgment of Sponsorship
This work was sponsored by the American Association of State Highway and Transportation Officials (AASHTO) in cooperation with the Federal Highway Administration and was conducted in the National Cooperative Highway Research Program which is administered by the Transportation Research Board of the National Research Council.
Disclaimer
This is the final draft as submitted by the research agency. The opinions and conclusions expressed or implied in this report are those of the research agency. They are not necessarily those of the Transportation Research Board, the National Research Council, the Federal Highway Administration, AASHTO, or the individual States participating in the National Cooperative Highway Research program.
Acknowledgements
The research team for NCHRP Project 1-37A: Development of the 2002 Guide for the Design of New and Rehabilitated Pavement Structures consisted of Applied Research Associates, Inc., ERES Consultants Division (ARA-ERES) as the prime contractor with Arizona State University (ASU) as the primary subcontractor. Fugro-BRE, Inc., the University of Maryland, and Advanced Asphalt Technologies, LLC served as subcontractors to either ARA-ERES or ASU along with several independent consultants.
Research into the subject area covered in this Appendix was conducted at Fugro-BRE and ASU. The authors of this Appendix are Harold L. Von Quintus, Amber Yau, Dr. M.W. Witczak, Mr. Dragos Andrei, and Dr. W.N. Houston.
Foreword
The appendix describes models developed to predict flexible pavement smoothness (the performance indicator used to characterize overall pavement condition in the Design Guide). The information contained in this appendix serves as a supporting reference to PART 3, Chapters 3 and 6 of the Design Guide.
This document is the first in a series of three volumes on flexible pavement smoothness prediction. The other volumes are:
| Appendix OO-2: | Revised Smoothness Prediction Models for Flexible Pavement |
| Appendix OO-3: | Addendum to Appendix OO—Estimation of Distress Quantities for Smoothness Models for HMA-Surface Pavements |
i
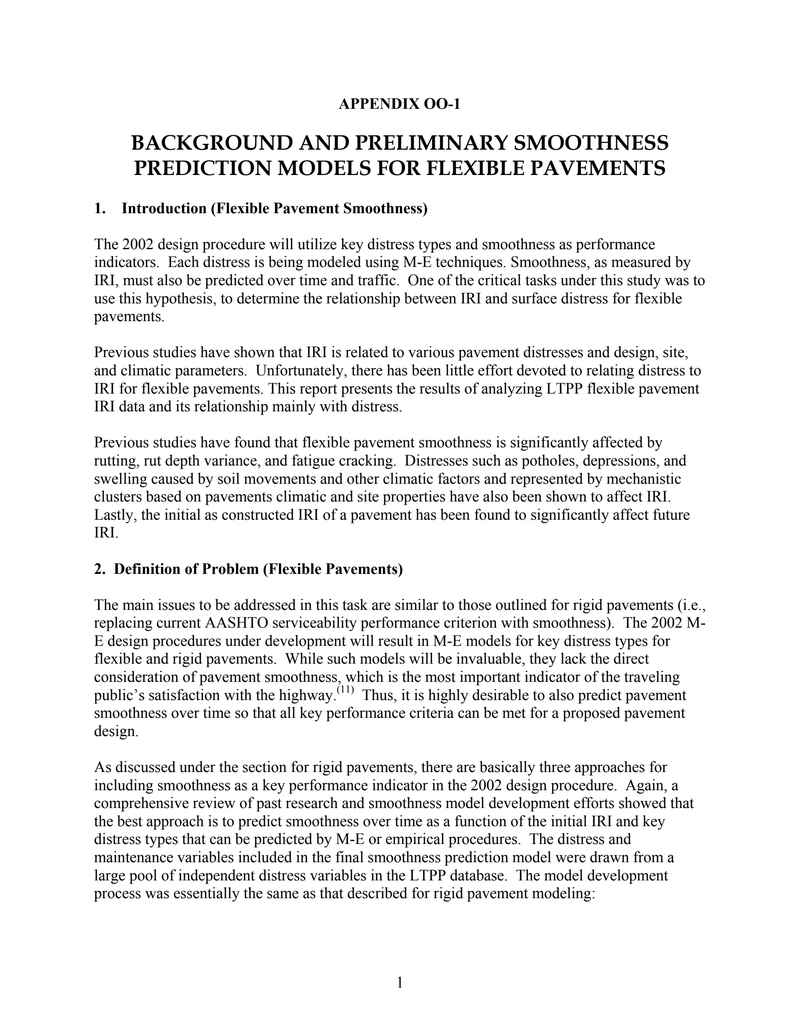
APPENDIX OO-1
BACKGROUND AND PRELIMINARY SMOOTHNESS PREDICTION MODELS FOR FLEXIBLE PAVEMENTS
1. Introduction (Flexible Pavement Smoothness)
The 2002 design procedure will utilize key distress types and smoothness as performance indicators. Each distress is being modeled using M-E techniques. Smoothness, as measured by IRI, must also be predicted over time and traffic. One of the critical tasks under this study was to use this hypothesis, to determine the relationship between IRI and surface distress for flexible pavements.
Previous studies have shown that IRI is related to various pavement distresses and design, site, and climatic parameters. Unfortunately, there has been little effort devoted to relating distress to IRI for flexible pavements. This report presents the results of analyzing LTPP flexible pavement IRI data and its relationship mainly with distress.
Previous studies have found that flexible pavement smoothness is significantly affected by rutting, rut depth variance, and fatigue cracking. Distresses such as potholes, depressions, and swelling caused by soil movements and other climatic factors and represented by mechanistic clusters based on pavements climatic and site properties have also been shown to affect IRI. Lastly, the initial as constructed IRI of a pavement has been found to significantly affect future IRI.
2. Definition of Problem (Flexible Pavements)
The main issues to be addressed in this task are similar to those outlined for rigid pavements (i.e., replacing current AASHTO serviceability performance criterion with smoothness). The 2002 M-E design procedures under development will result in M-E models for key distress types for flexible and rigid pavements. While such models will be invaluable, they lack the direct consideration of pavement smoothness, which is the most important indicator of the traveling public's satisfaction with the highway.(11) Thus, it is highly desirable to also predict pavement smoothness over time so that all key performance criteria can be met for a proposed pavement design.
As discussed under the section for rigid pavements, there are basically three approaches for including smoothness as a key performance indicator in the 2002 design procedure. Again, a comprehensive review of past research and smoothness model development efforts showed that the best approach is to predict smoothness over time as a function of the initial IRI and key distress types that can be predicted by M-E or empirical procedures. The distress and maintenance variables included in the final smoothness prediction model were drawn from a large pool of independent distress variables in the LTPP database. The model development process was essentially the same as that described for rigid pavement modeling:
3
- Conduct a literature review of past research studies to identify distress types that influence smoothness.
- Assemble databases for original and overlaid model development. The databases must include the distress variables identified in step 1.
- Evaluate the quality of databases and identify missing/erroneous data items.
- Develop methods and procedures for estimating important missing data elements and clean data by resolving anomalies.
- Select the appropriate smoothness model form (should be capable of estimating smoothness loss incrementally).
- Develop tentative smoothness prediction models for original and overlaid flexible pavements.
- Perform sensitivity analysis (model verification) on tentative models.
- Select final smoothness models.
The steps outlined for model development are summarized in the flow chart shown in figure 1 of this report. This approach has been used in previous studies and has been improved to provide practical prediction models.
3. Overview of Distress Based Flexible Pavement Smoothness/Serviceability Models Developed from Previous Research
Several research studies have successfully modeled smoothness or serviceability (which is highly correlated to smoothness) using key pavement distress types for both original and overlaid pavements.(1, 4, 11, 12, 28) The results from some of these studies are discussed in the next few sections.
Distress that Influence Flexible Pavement Smoothness
AASHTO Serviceability Equation(1)
PSR = 5.03 – 1.91 log (1 + SV) – 0.01 (C + P)0.5 – 1.38 RD2 (22)
where
| PSR | = present serviceability rating (panel mean rating) |
| SV | = slope variance |
| C | = major cracking in ft per 1000 sq ft area |
| P | = bituminous patching in sq ft per 1000 sq ft area |
| RD | = average rut depth of both wheelpaths in inches measured at the center of a 4-ft span in the most deeply rutted part of the wheel path |
4
5
Slope variance is defined as follows:
SV = (ΣY2 − (1/n)(ΣY)2)/(n − 1) (23)
where
Y = difference between two elevations 9 in. apart
n = number of elevation readings
The accuracy of the models can be judged by the following statistics:
R2 = 84 percent
SEE = 0.38 PSR points
The statistics show that PSR is well correlated with smoothness and distress for flexible pavements. However, smoothness alone accounted for most of the variation observed in serviceability. This is to be expected because distress (medium to high severity, in most cases) on a pavement surface distorts the longitudinal profile of the pavement, which directly affects smoothness.
FHWA Zero-Maintenance Pavements Study(11)
Several research studies have successfully modeled smoothness or serviceability using key pavement distress types for flexible pavements(4, 11, 12, 24)
The following model was developed using data from the AASHO Road Test and relates serviceability to distress.
PSR = 4.5 − 0.49RD − 1.16RDV0.5(1 − 0.087RDV0.5)
− 0.13log(1 + TC) − 0.0344(AC + P)0.5 (24)
R2 = 0.76, SEE = 0.455 points, N = 95
where
RD = rut depth in both wheel paths of the pavement, in
RDV = rut depth variance, in2*100
AC = class 2 or class 3 alligator or fatigue cracking, ft2/1000ft2
TC = transverse and longitudinal cracking, ft2/1000ft2
P = patching, ft2/1000ft2
The model has R2 values comparable to the AASHTO flexible pavement serviceability equation (equation 24). The SEE reported was slightly larger than that of the AASHTO equation. However, it is clear from these models that user-defined serviceability can be predicted
6
预览内容由文件识别整理,表格、公式及文字请以原始文件为准。
原文图片预览
PAGE IMAGES

下载标准文件
2appendices_OO
英语 · PDF · 6 页 · 820.16 KB