标准信息
STANDARD INFORMATION- 标准编号
- 2appendices_HH
- 所属分类
- 其他国外标准与工程资料
- 文件语言
- 英语
- 文件格式
- 文件页数
- 6 页
- 文件大小
- 2.4 MB
· 更新:
标准简介
OVERVIEW中文简介
标准 2appendices_HH 的预览内容
English summary
Preview of standard 2appendices_HH
以上为根据文件整理的内容简介。
标准内容预览
DOCUMENT PREVIEWGENERAL OVERVIEW OF CALIBRATION OF THERMAL CRACKING MODEL BY HIERARCHICAL LEVELS
The calibration of the thermal cracking model was accomplished at three hierarchical levels of analysis. Forty two PTI pavement sections were used for the calibration: 22 GPS sections from the LTPP database, 14 sections from the Canadian C-SHRP program, one section from Peoria, IL, and 5 MnROAD cells from the Minnesota DOT. Details and location of the sections are found in the main body of this Appendix.
The calibration of the Paris Law equation was accomplished by using the SHRP and C-SHRP sections.
As shown in Figure A-1, the main inputs required for predicting thermal cracking are the creep compliance and the tensile strength. This is constant at all hierarchical levels. Table A-1 summarizes this data for the forty-two PTI pavement sections included in the analysis.
Level 1 Analysis
The input parameters needed to calibrate the Level 1 analysis of the TC model are:
- Creep compliance data at three different temperatures: -20°C (-4 °F), -10°C (14 °F), and 0 °C (32 °F) for 1, 2, 5, 10, 20, 50, and 100 second loading time.
- Tensile Strength at −10°C.
The calibration of the Paris Law equation, rendered a β factor equals to 5 for the Level 1 analysis. More details of the model can be found on Part 3, Chapter 3 of the Design Guide. Refer also to Annex B for calibration details and notes.
The reliability of the thermal cracking prediction was evaluated in two different ways: by using the actual historic pavement temperatures during the design period, and by using estimated temperatures based on the Enhanced Integrated Climatic Model (EICM) files. The predicted thermal cracking was compared to the measured thermal cracking and the prediction errors are shown in Figure A-2 and A-3. The average prediction errors were found to be −9.0 ft and 16.2 ft. for the first and second method, respectively. This comparison illustrates the power and the importance of inputting actual historic climatic data for the design period instead of estimated data.
Level 2 Analysis
The input parameters needed to calibrate the Level 2 analysis of the TC model are:
- Creep compliance data at -10°C (14 °F) for 1, 2, 5, 10, 20, 50, and 100 second loading time.
- Tensile Strength at −10°C.
6
Acknowledgment of Sponsorship
This work was sponsored by the American Association of State Highway and Transportation Officials (AASHTO) in cooperation with the Federal Highway Administration and was conducted in the National Cooperative Highway Research Program which is administered by the Transportation Research Board of the National Research Council.
Disclaimer
This is the final draft as submitted by the research agency. The opinions and conclusions expressed or implied in this report are those of the research agency. They are not necessarily those of the Transportation Research Board, the National Research Council, the Federal Highway Administration, AASHTO, or the individual States participating in the National Cooperative Highway Research program.
Acknowledgements
The research team for NCHRP Project 1-37A: Development of the 2002 Guide for the Design of New and Rehabilitated Pavement Structures consisted of Applied Research Associates, Inc., ERES Consultants Division (ARA-ERES) as the prime contractor with Arizona State University (ASU) as the primary subcontractor. Fugro-BRE, Inc., the University of Maryland, and Advanced Asphalt Technologies, LLC served as subcontractors to either ARA-ERES or ASU along with several independent consultants.
Research into the subject area covered in this Appendix was conducted at ASU as well by consultants to ASU under NCHRP Projects 1-37A as well as 9-19, Superpave Support and Performance Models Management. As the principal investigator on NCHRP 9-19 and flexible pavement team leaded on NCHRP 1-37A, Dr. M.W. Witczak lead the entire research effort. He was assisted by Dr. Reynaldo Roque, Dr. Dennis Hiltunen, and Dr. William G. Buttlar in the modification and re-calibration of the Superpave Thermal Cracking model (TCMODEL) developed under the SHRP A005 research contract. Other authors of this Appendix include Drs. Claudia Zapata, W.M. Mirza, Manuel Ayers, and Messrs. Mohammed El-Basyouny and A. Sotil who assisted in the model recalibration effort.
Foreword
The Appendix covers the details of the field calibration of the thermal cracking model that was originally developed under the NCHRP 9-19 research project and recalibrated for the various input hierarchical levels under NCHRP 1-37A. This appendix serves as a supporting reference to PART 3, Chapters 3 and 6.
2
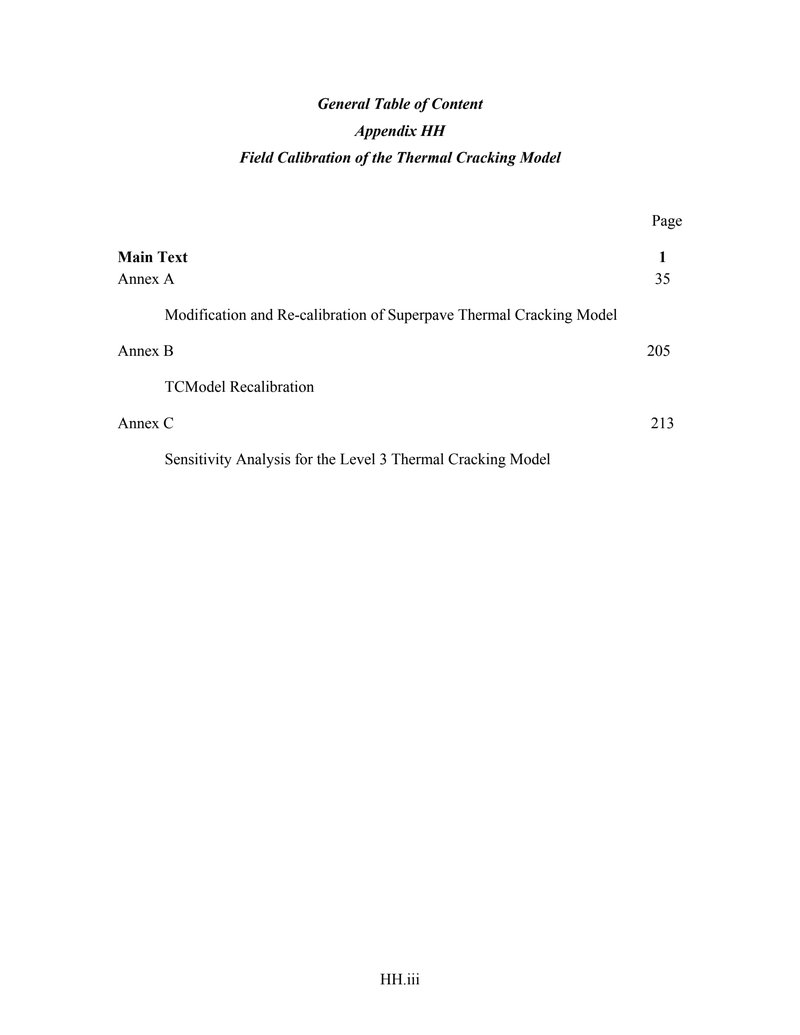
General Table of Content
Appendix HH
Field Calibration of the Thermal Cracking Model
| Page | |
|---|---|
| Main Text | 1 |
| Annex A | 35 |
| Modification and Re-calibration of Superpave Thermal Cracking Model | |
| Annex B | 205 |
| TCModel Recalibration | |
| Annex C | 213 |
| Sensitivity Analysis for the Level 3 Thermal Cracking Model | |
3
INTRODUCTION
This Appendix covers the details of the field calibration of the thermal cracking model that was originally developed under the NCHRP 9-19 research project: Superpave Support and Performance Models Management. The main purpose of this study, developed by Witzak, Roque, Hiltunen, and Buttlar, was the modification and re-calibration of the Superpave Thermal Cracking model (TCMODEL) developed under the SHRP A005 research contract. The details of the NCHRP 9-19 research results can be found in Annex A.
The re-calibrated model was incorporated into the 2002 Design Guide software based on three different levels of analysis. A general overview of the parameters needed for each level of analysis is presented herein along with the calibration results obtained.
Based on the calibration results of the TCMODEL incorporated into the 2002 Design Guide and given the poor performance of the model for the Level 3 analysis, the ASU research team decided to modify the correlations involved in the process at this level. The new correlations are also presented in the main body of this Appendix.
In addition to a new approach for Level 3 analysis, the results from a study on different calibration factors to the Paris Law are shown in this Appendix. The details of the study can be found in Annex B.
Lastly, a sensitivity analysis was carried out to evaluate the validity of the Level 3 Thermal Cracking model (TCModel) built into the 2002 Design Guide. Details of the analysis can be found in Annex C.
THEORETICAL BACKGROUND
The thermal cracking model in the Design Guide is an enhanced version of the approach originally developed under the SHRP A-005 research contract. A study was completed under the NCHRP 9-19 "Superpave Models" project to facilitate the incorporation of this thermal cracking model (TCMODEL) and related software for use in the Design Guide.
Several major updates have been made to the original TCMODEL and software. These enhancements included the incorporation of an improved analysis technique for converting raw data from the Superpave Indirect Tensile Test (IDT) into fundamental viscoelastic properties of the asphalt mixture, recalibration of the TCMODEL to reflect updated analysis procedures and additional new field data, and the development of comprehensive documentation for the TCMODEL approach.
Thermal Cracking Model
The amount of transverse cracking expected in the pavement system is predicted by relating the crack depth to an amount of cracking (crack frequency) by the following expression:
4
Cf = β1 * N(log C / hac / σ) (Eq. 1)
where:
| Cf | = Observed amount of thermal cracking. |
| β1 | = Regression coefficient determined through field calibration. |
| N() | = Standard normal distribution evaluated at (). |
| σ | = Standard deviation of the log of the depth of cracks in the pavement. |
| C | = Crack depth. |
| hac | = Thickness of asphalt layer. |
The amount of crack propagation induced by a given thermal cooling cycle is predicted using the Paris law of crack propagation:
ΔC = AΔKn (Eq. 2)
where:
| ΔC | = Change in the crack depth due to a cooling cycle. |
| ΔK | = Change in the stress intensity factor due to a cooling cycle. |
| A, n | = Fracture parameters for the asphalt mixture. |
The approach used to evaluate the A and n parameters is based, in part, upon previous work by Schapery, Molenaar and Lytton. Recalling that the master creep compliance curve can be expressed by the power function to yield:
D(ξ) = D0 + D1ξm (Eq. 3)
The m value, derived from the compliance curve is used to compute the n fracture parameter through the equation:
n = 0.8(1 + 1/m) (Eq. 4)
Once the n value is known, the A fracture parameter is computed from the equation:
A = 10(β*(4.389 - 2.52*log(E*σm*n))) (Eq. 5)
where:
| E | = Mixture stiffness. |
| σm | = Undamaged mixture tensile strength. |
| β | = Calibration parameter. |
GENERAL OVERVIEW OF CALIBRATION OF THERMAL CRACKING MODEL BY HIERARCHICAL LEVELS
The calibration of the thermal cracking model was accomplished at three hierarchical levels of analysis. Forty two PTI pavement sections were used for the calibration: 22 GPS sections from the LTPP database, 14 sections from the Canadian C-SHRP program, one section from Peoria, IL, and 5 MnROAD cells from the Minnesota DOT. Details and location of the sections are found in the main body of this Appendix.
The calibration of the Paris Law equation was accomplished by using the SHRP and C-SHRP sections.
As shown in Figure A-1, the main inputs required for predicting thermal cracking are the creep compliance and the tensile strength. This is constant at all hierarchical levels. Table A-1 summarizes this data for the forty-two PTI pavement sections included in the analysis.
Level 1 Analysis
The input parameters needed to calibrate the Level 1 analysis of the TC model are:
- Creep compliance data at three different temperatures: -20°C (-4 °F), -10°C (14 °F), and 0 °C (32 °F) for 1, 2, 5, 10, 20, 50, and 100 second loading time.
- Tensile Strength at −10°C.
The calibration of the Paris Law equation, rendered a β factor equals to 5 for the Level 1 analysis. More details of the model can be found on Part 3, Chapter 3 of the Design Guide. Refer also to Annex B for calibration details and notes.
The reliability of the thermal cracking prediction was evaluated in two different ways: by using the actual historic pavement temperatures during the design period, and by using estimated temperatures based on the Enhanced Integrated Climatic Model (EICM) files. The predicted thermal cracking was compared to the measured thermal cracking and the prediction errors are shown in Figure A-2 and A-3. The average prediction errors were found to be −9.0 ft and 16.2 ft. for the first and second method, respectively. This comparison illustrates the power and the importance of inputting actual historic climatic data for the design period instead of estimated data.
Level 2 Analysis
The input parameters needed to calibrate the Level 2 analysis of the TC model are:
- Creep compliance data at -10°C (14 °F) for 1, 2, 5, 10, 20, 50, and 100 second loading time.
- Tensile Strength at −10°C.
6
预览内容由文件识别整理,表格、公式及文字请以原始文件为准。
原文图片预览
PAGE IMAGES


下载标准文件
2appendices_HH
英语 · PDF · 6 页 · 2.4 MB