标准信息
STANDARD INFORMATION- 标准编号
- 2appendices_EE
- 所属分类
- 其他国外标准与工程资料
- 文件语言
- 英语
- 文件格式
- 文件页数
- 6 页
- 文件大小
- 3.28 MB
· 更新:
标准简介
OVERVIEW中文简介
标准 2appendices_EE 的预览内容
English summary
Preview of standard 2appendices_EE
以上为根据文件整理的内容简介。
标准内容预览
DOCUMENT PREVIEWTable 9 - Unbound Materials Data
- Layer Number
- Layer Type
- Dry Thermal Conductivity
- Dry Heat Capacity
- Liquid Limit
- Plastic Limit
- Plasticity Index
- Percent Passing #200 Sieve
- Percent Passing #4 Sieve
- Diameter D60
- Optimum Moisture Content from LTTP Database
- Estimated Optimum Moisture Content for Level 3 Analysis
- Maximum Dry Unit Weight from LTPP Database
- Estimated Maximum Dry Unit Weight for Level 3 Analysis
- Specific Gravity of Solids
- Saturated Hydraulic Conductivity
- AASHTO Soil Classification
- Unified Soil Classification System (USCS) Classification
- Estimated Resilient Modulus based on AASHTO Soil Classification
The following tables contain the measured distress information needed to calibrate the results obtained from the analysis:
Table 10 – Distress Data – Rutting
- Survey Date
- Maximum displacement between reference wire line and pavement surface in left lane half, LLH-Depth Mean, in inches
- Maximum displacement between reference wire line and pavement surface in right lane half, RLH-Depth Mean, in inches
- Maximum value of LLH-Depth Mean or RLH-Depth Mean, in inches
- Average displacement between reference wire line and pavement surface between left lane half and right lane half data, in inches
Table 11 – Distress Data – Alligator Cracking
- Survey Date
- Area of low severity alligator cracking, in ft2
- Area of medium severity alligator cracking, in ft2
- Area of high severity alligator cracking, in ft2
- Total Sum alligator cracking, in ft2
Table 12 – Distress Data - Longitudinal Cracking in the Wheel Path
- Length of low severity longitudinal cracking in the wheel path, in ft
- Length of medium severity longitudinal cracking in the wheel path, in ft
- Length of high severity longitudinal cracking in the wheel path, in ft
- Total Sum alligator cracking, in ft
6
Acknowledgment of Sponsorship
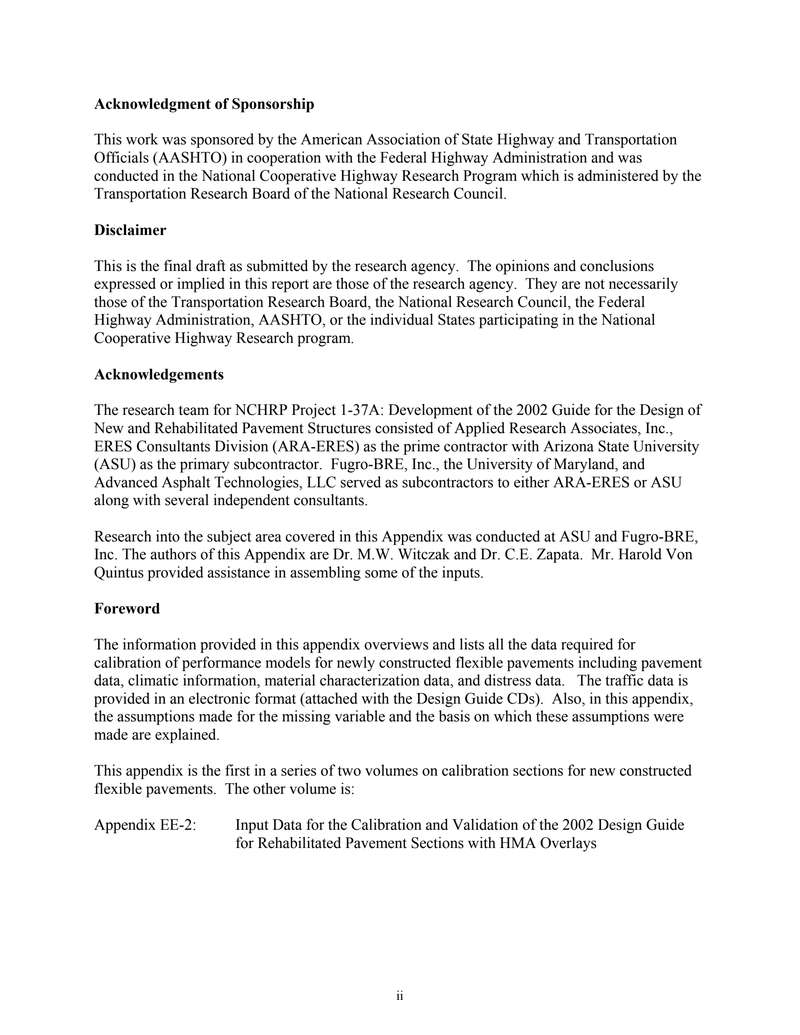
This work was sponsored by the American Association of State Highway and Transportation Officials (AASHTO) in cooperation with the Federal Highway Administration and was conducted in the National Cooperative Highway Research Program which is administered by the Transportation Research Board of the National Research Council.
Disclaimer
This is the final draft as submitted by the research agency. The opinions and conclusions expressed or implied in this report are those of the research agency. They are not necessarily those of the Transportation Research Board, the National Research Council, the Federal Highway Administration, AASHTO, or the individual States participating in the National Cooperative Highway Research program.
Acknowledgements
The research team for NCHRP Project 1-37A: Development of the 2002 Guide for the Design of New and Rehabilitated Pavement Structures consisted of Applied Research Associates, Inc., ERES Consultants Division (ARA-ERES) as the prime contractor with Arizona State University (ASU) as the primary subcontractor. Fugro-BRE, Inc., the University of Maryland, and Advanced Asphalt Technologies, LLC served as subcontractors to either ARA-ERES or ASU along with several independent consultants.
Research into the subject area covered in this Appendix was conducted at ASU and Fugro-BRE, Inc. The authors of this Appendix are Dr. M.W. Witczak and Dr. C.E. Zapata. Mr. Harold Von Quintus provided assistance in assembling some of the inputs.
Foreword
The information provided in this appendix overviews and lists all the data required for calibration of performance models for newly constructed flexible pavements including pavement data, climatic information, material characterization data, and distress data. The traffic data is provided in an electronic format (attached with the Design Guide CDs). Also, in this appendix, the assumptions made for the missing variable and the basis on which these assumptions were made are explained.
This appendix is the first in a series of two volumes on calibration sections for new constructed flexible pavements. The other volume is:
| Appendix EE-2: | Input Data for the Calibration and Validation of the 2002 Design Guide for Rehabilitated Pavement Sections with HMA Overlays |
2
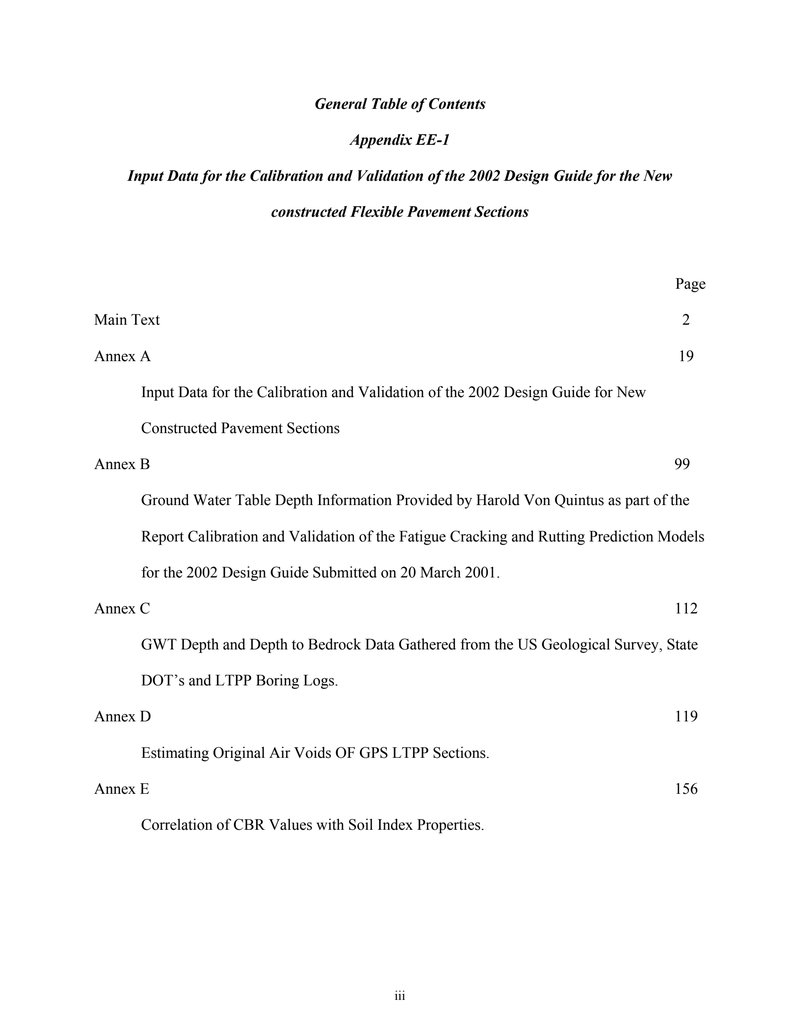
General Table of Contents
Appendix EE-1
Input Data for the Calibration and Validation of the 2002 Design Guide for the New constructed Flexible Pavement Sections
| Page | |
|---|---|
| Main Text | 2 |
| Annex A | 19 |
| Input Data for the Calibration and Validation of the 2002 Design Guide for New Constructed Pavement Sections | |
| Annex B | 99 |
| Ground Water Table Depth Information Provided by Harold Von Quintus as part of the Report Calibration and Validation of the Fatigue Cracking and Rutting Prediction Models for the 2002 Design Guide Submitted on 20 March 2001. | |
| Annex C | 112 |
| GWT Depth and Depth to Bedrock Data Gathered from the US Geological Survey, State DOT's and LTPP Boring Logs. | |
| Annex D | 119 |
| Estimating Original Air Voids OF GPS LTPP Sections. | |
| Annex E | 156 |
| Correlation of CBR Values with Soil Index Properties. |
3
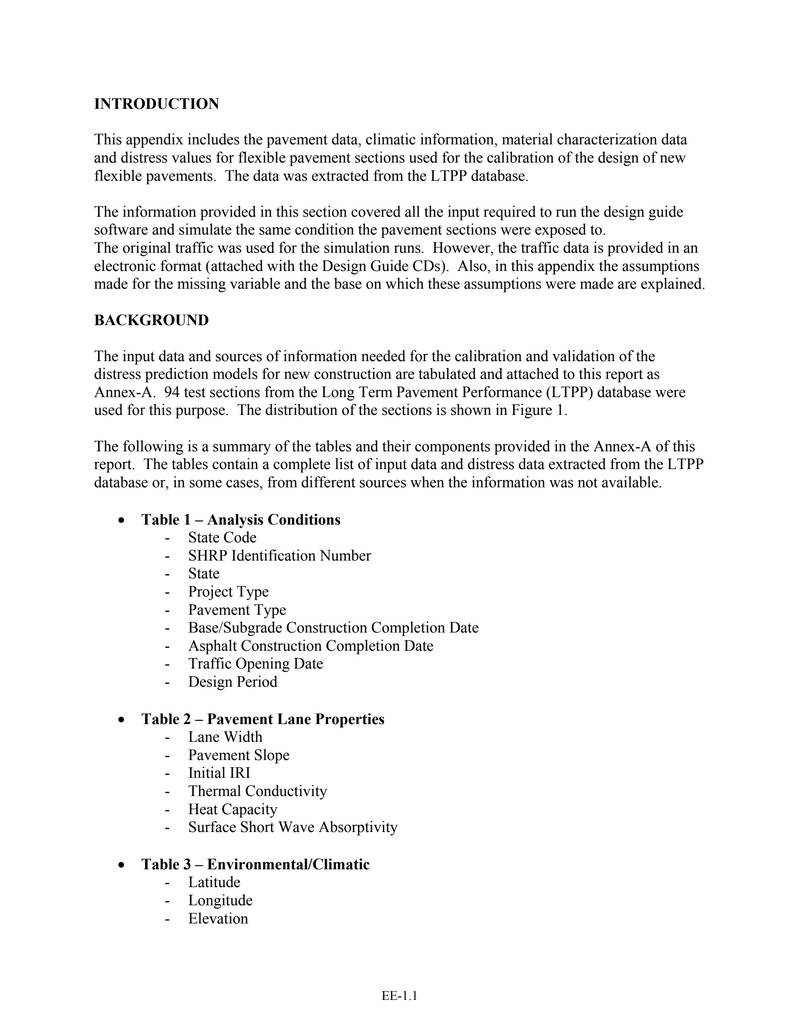
INTRODUCTION
This appendix includes the pavement data, climatic information, material characterization data and distress values for flexible pavement sections used for the calibration of the design of new flexible pavements. The data was extracted from the LTPP database.
The information provided in this section covered all the input required to run the design guide software and simulate the same condition the pavement sections were exposed to. The original traffic was used for the simulation runs. However, the traffic data is provided in an electronic format (attached with the Design Guide CDs). Also, in this appendix the assumptions made for the missing variable and the base on which these assumptions were made are explained.
BACKGROUND
The input data and sources of information needed for the calibration and validation of the distress prediction models for new construction are tabulated and attached to this report as Annex-A. 94 test sections from the Long Term Pavement Performance (LTPP) database were used for this purpose. The distribution of the sections is shown in Figure 1.
The following is a summary of the tables and their components provided in the Annex-A of this report. The tables contain a complete list of input data and distress data extracted from the LTPP database or, in some cases, from different sources when the information was not available.
- Table 1 – Analysis Conditions
- State Code
- SHRP Identification Number
- State
- Project Type
- Pavement Type
- Base/Subgrade Construction Completion Date
- Asphalt Construction Completion Date
- Traffic Opening Date
- Design Period
- Table 2 – Pavement Lane Properties
- Lane Width
- Pavement Slope
- Initial IRI
- Thermal Conductivity
- Heat Capacity
- Surface Short Wave Absorptivity
- Table 3 – Environmental/Climatic
- Latitude
- Longitude
- Elevation
4
- Groundwater Table Depth
- Table 4 – Pavement Structure
- Number of Layers
- Layer Number
- Layer Type
- Representative Thickness
- Table 5 – Aggregate Gradation for Asphalt Mix
- Layer Number
- Layer Type
- Percentage Retained ¾" Sieve
- Percentage Retained 3/8" Sieve
- Percentage Retained #4 Sieve
- Percentage Passing #200 Sieve
- Table 6 – Effective Binder Content by Volume at Time of Construction
- Layer Number
- Layer Time
- Binder Content by Weight, Pb
- Specific Gravity of the Binder, Gb
- Bulk Specific Gravity of the Mix, Gmb
- Maximum Theoretical Specific Gravity of the Mix, Gmm
- Bulk Specific Gravity of the Aggregate, Gsb
- Effective Specific Gravity of the Aggregate, Gse
- Effective Binder Content by Volume at Time of Construction, Vbe
- Table 7 – Original Air Voids (at Time of Construction) and Total Unit Weight
- Layer Number
- Layer Type
- Air Voids at Age = t
- Age = t
- Mean Annual Air Temperature, Maat
- Original Viscosity at 77 °F
- Original Air Voids
- Total Unit Weight
- Table 8 – Asphalt Binder Data
- Layer Number
- Layer Type
- Viscosity Grade
- Penetration Grade
- Penetration at 77F
- Viscosity at 140F
- Viscosity at 275F
Table 9 - Unbound Materials Data
- Layer Number
- Layer Type
- Dry Thermal Conductivity
- Dry Heat Capacity
- Liquid Limit
- Plastic Limit
- Plasticity Index
- Percent Passing #200 Sieve
- Percent Passing #4 Sieve
- Diameter D60
- Optimum Moisture Content from LTTP Database
- Estimated Optimum Moisture Content for Level 3 Analysis
- Maximum Dry Unit Weight from LTPP Database
- Estimated Maximum Dry Unit Weight for Level 3 Analysis
- Specific Gravity of Solids
- Saturated Hydraulic Conductivity
- AASHTO Soil Classification
- Unified Soil Classification System (USCS) Classification
- Estimated Resilient Modulus based on AASHTO Soil Classification
The following tables contain the measured distress information needed to calibrate the results obtained from the analysis:
Table 10 – Distress Data – Rutting
- Survey Date
- Maximum displacement between reference wire line and pavement surface in left lane half, LLH-Depth Mean, in inches
- Maximum displacement between reference wire line and pavement surface in right lane half, RLH-Depth Mean, in inches
- Maximum value of LLH-Depth Mean or RLH-Depth Mean, in inches
- Average displacement between reference wire line and pavement surface between left lane half and right lane half data, in inches
Table 11 – Distress Data – Alligator Cracking
- Survey Date
- Area of low severity alligator cracking, in ft2
- Area of medium severity alligator cracking, in ft2
- Area of high severity alligator cracking, in ft2
- Total Sum alligator cracking, in ft2
Table 12 – Distress Data - Longitudinal Cracking in the Wheel Path
- Length of low severity longitudinal cracking in the wheel path, in ft
- Length of medium severity longitudinal cracking in the wheel path, in ft
- Length of high severity longitudinal cracking in the wheel path, in ft
- Total Sum alligator cracking, in ft
6
预览内容由文件识别整理,表格、公式及文字请以原始文件为准。
原文图片预览
PAGE IMAGES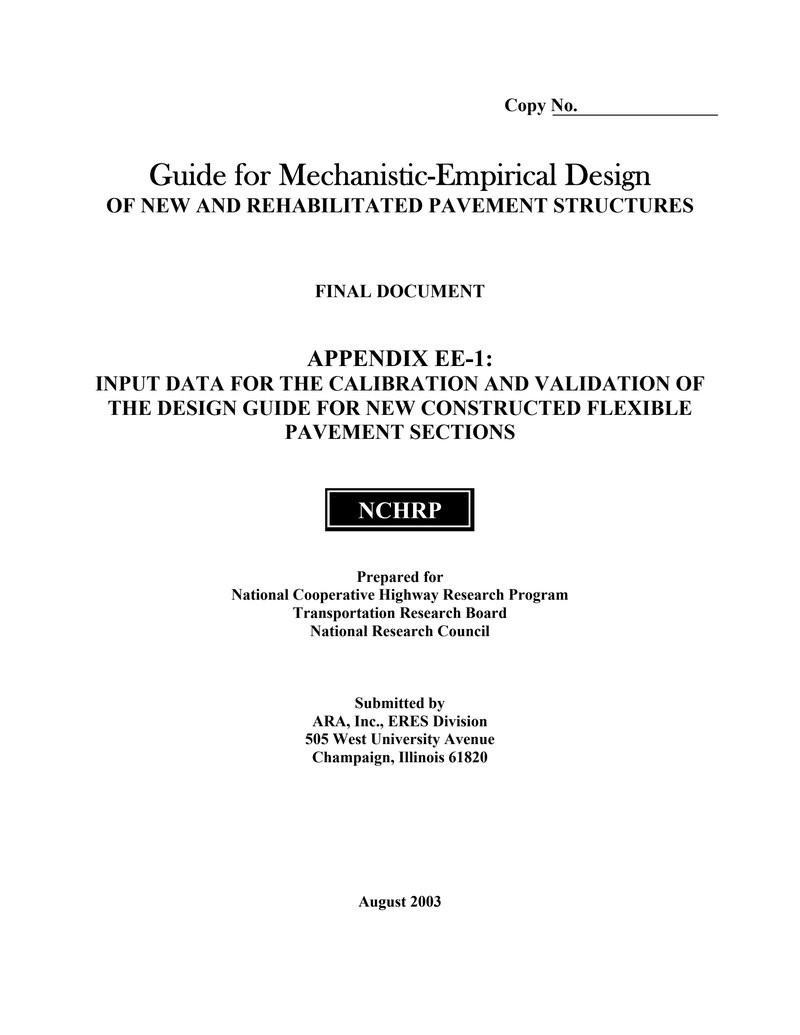
下载标准文件
2appendices_EE
英语 · PDF · 6 页 · 3.28 MB