标准信息
STANDARD INFORMATION- 标准编号
- 2appendices_AA
- 所属分类
- 其他国外标准与工程资料
- 文件语言
- 英语
- 文件格式
- 文件页数
- 6 页
- 文件大小
- 22.06 MB
· 更新:
标准简介
OVERVIEW中文简介
标准 2appendices_AA 的预览内容
English summary
Preview of standard 2appendices_AA
以上为根据文件整理的内容简介。
标准内容预览
DOCUMENT PREVIEWLIST OF TABLES (CONT.)
Table 28b. Truck directional and lane distribution factors from the region for Roadway B ....................................................................................................84
Table 28c. Truck directional and lane distribution factors from the region for Roadway C ....................................................................................................84
Table 29. Traffic characteristics for example problems ....................................................................................................85
Table 30a. Normalized truck distribution spectra from the region/state for Roadway A ....................................................................................................85
Table 30b. Normalized truck distribution spectra from the region/state for Roadway B ....................................................................................................85
Table 30c. Normalized truck distribution spectra from the region/state for Roadway C ....................................................................................................85
Table 31. Representative truck distribution spectrum for Roadways A, B and C ....................................................................................................86
Table 32a. Seasonal (monthly) distribution factors from the region for Roadway A ....................................................................................................89
Table 32b. Seasonal (monthly) distribution factors from the region for Roadway B ....................................................................................................89
Table 32c. Seasonal (monthly) distribution factors from the region for Roadway C ....................................................................................................90
Table 33a. Time of day distribution factors for Level 3 design for Roadways A ....................................................................................................92
Table 33b. Time of day distribution factors for Level 3 design for Roadways B ....................................................................................................93
Table 33c. Time of day distribution factors for Level 3 design for Roadways C ....................................................................................................93
Table 34. Traffic characteristics used for Level 4 inputs for example problems ....................................................................................................94
Table 35. Comparison of the differences among the levels of inputs for selected axle load groups using the average daily traffic ....................................................................................................96
Table 36. Number of 80kN Equivalent Single Axle Loads computed (using AASHTO load equivalency factors) for the first year for the four input levels for each example problem ....................................................................................................96
6
Acknowledgment of Sponsorship
This work was sponsored by the American Association of State Highway and Transportation Officials (AASHTO) in cooperation with the Federal Highway Administration and was conducted in the National Cooperative Highway Research Program which is administered by the Transportation Research Board of the National Research Council.
Disclaimer
This is the final draft as submitted by the research agency. The opinions and conclusions expressed or implied in this report are those of the research agency. They are not necessarily those of the Transportation Research Board, the National Research Council, the Federal Highway Administration, AASHTO, or the individual States participating in the National Cooperative Highway Research program.
Acknowledgements
The research team for NCHRP Project 1-37A: Development of the 2002 Guide for the Design of New and Rehabilitated Pavement Structures consisted of Applied Research Associates, Inc., ERES Consultants Division (ARA-ERES) as the prime contractor with Arizona State University (ASU) as the primary subcontractor. Fugro-BRE, Inc., the University of Maryland, and Advanced Asphalt Technologies, LLC served as subcontractors to either ARA-ERES or ASU along with several independent consultants.
Research into the subject area covered in this Appendix was conducted at ARA-ERES and Fugro-BRE Inc. The authors of this Appendix are Harold L. Von Quintus, Weng On Tam, and Nasir Gharaibeh. Mark Hallenbeck with the Washington State Transportation Center - University of Washington served as a project consultant. John Hallin (ARA-ERES), Matthew Witzak (ASU) and Mike Darter (ARA-ERES) provided an oversight of all activities as project team leaders.
Foreword
The purpose of this document is two-fold. The first objective is to present and discuss the traffic module of the Design Guide software which provides traffic information and input data that are needed for the incremental damage computations in predicting load related distresses. The second objective is to present the data analyses and research that were completed to support the assumptions made in developing the traffic module and for determining the default values when sufficient traffic data are unavailable to the user or designer.
The document is divided into five chapters and supported by eleven sub-appendices. It is a supporting reference to traffic related discussions presented in PART 2, Chapters 4, and PART 3, Chapters 3, 4, 6, and 7 of the Design Guide.
2
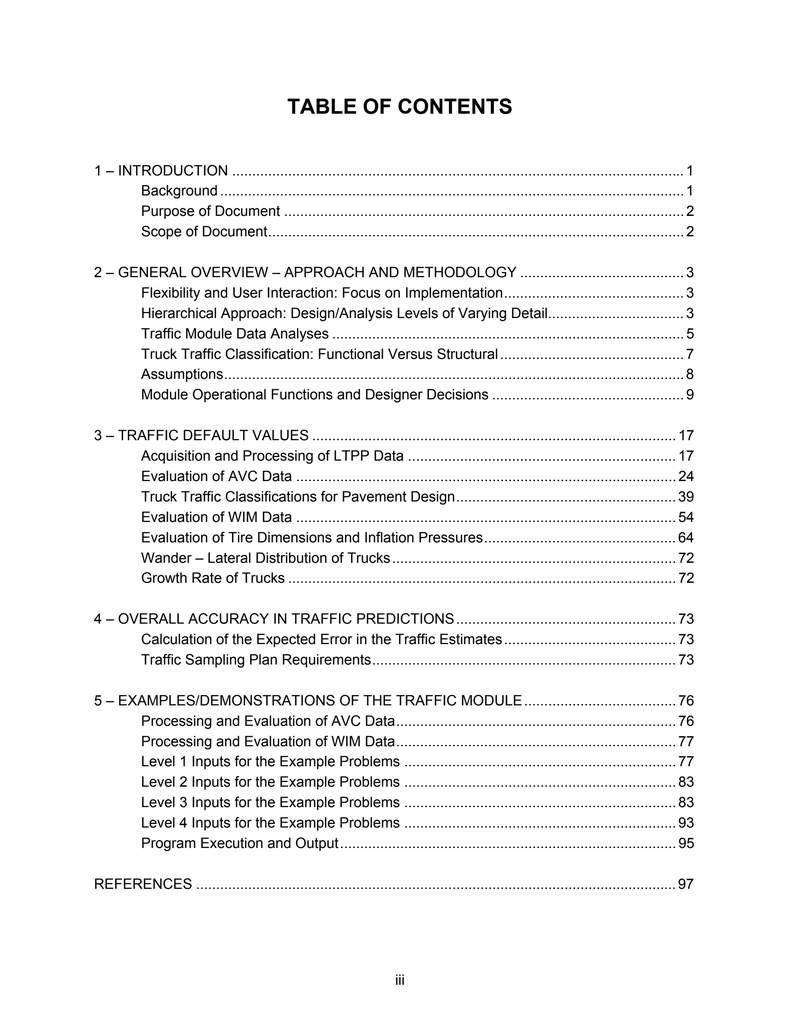
TABLE OF CONTENTS
| 1 – INTRODUCTION | 1 |
| Background | 1 |
| Purpose of Document | 2 |
| Scope of Document | 2 |
| 2 – GENERAL OVERVIEW – APPROACH AND METHODOLOGY | 3 |
| Flexibility and User Interaction: Focus on Implementation | 3 |
| Hierarchical Approach: Design/Analysis Levels of Varying Detail | 3 |
| Traffic Module Data Analyses | 5 |
| Truck Traffic Classification: Functional Versus Structural | 7 |
| Assumptions | 8 |
| Module Operational Functions and Designer Decisions | 9 |
| 3 – TRAFFIC DEFAULT VALUES | 17 |
| Acquisition and Processing of LTPP Data | 17 |
| Evaluation of AVC Data | 24 |
| Truck Traffic Classifications for Pavement Design | 39 |
| Evaluation of WIM Data | 54 |
| Evaluation of Tire Dimensions and Inflation Pressures | 64 |
| Wander – Lateral Distribution of Trucks | 72 |
| Growth Rate of Trucks | 72 |
| 4 – OVERALL ACCURACY IN TRAFFIC PREDICTIONS | 73 |
| Calculation of the Expected Error in the Traffic Estimates | 73 |
| Traffic Sampling Plan Requirements | 73 |
| 5 – EXAMPLES/DEMONSTRATIONS OF THE TRAFFIC MODULE | 76 |
| Processing and Evaluation of AVC Data | 76 |
| Processing and Evaluation of WIM Data | 77 |
| Level 1 Inputs for the Example Problems | 77 |
| Level 2 Inputs for the Example Problems | 83 |
| Level 3 Inputs for the Example Problems | 83 |
| Level 4 Inputs for the Example Problems | 93 |
| Program Execution and Output | 95 |
| REFERENCES | 97 |
3
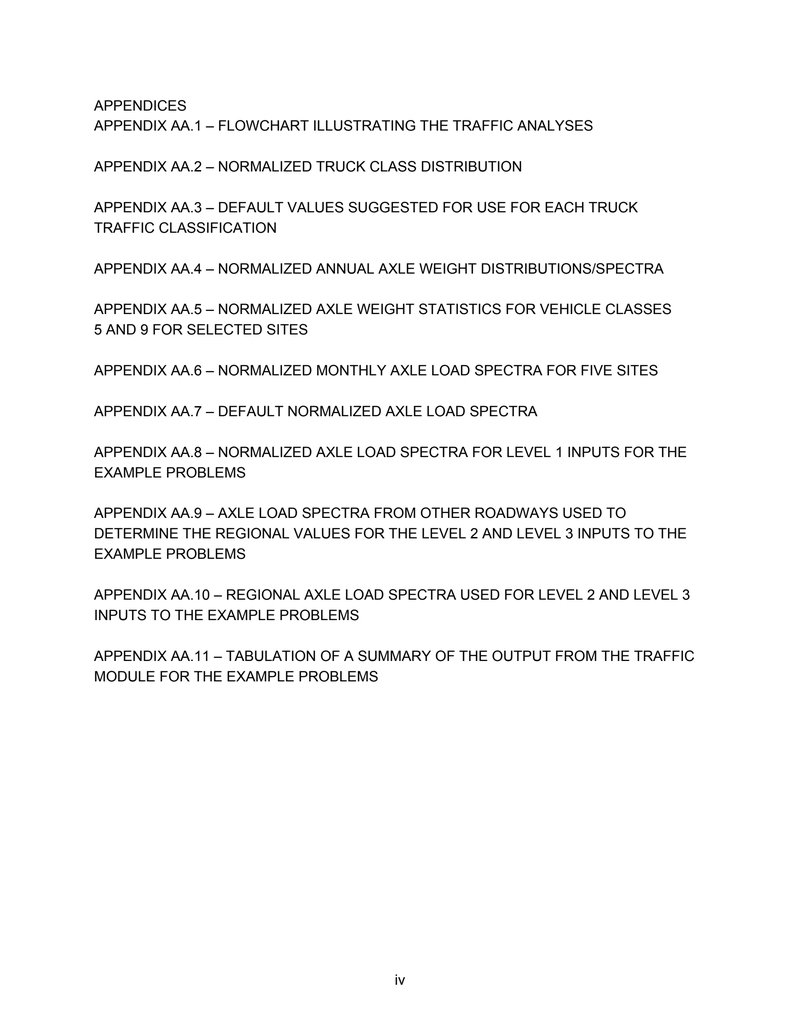
APPENDICES
APPENDIX AA.1 – FLOWCHART ILLUSTRATING THE TRAFFIC ANALYSES
APPENDIX AA.2 – NORMALIZED TRUCK CLASS DISTRIBUTION
APPENDIX AA.3 – DEFAULT VALUES SUGGESTED FOR USE FOR EACH TRUCK TRAFFIC CLASSIFICATION
APPENDIX AA.4 – NORMALIZED ANNUAL AXLE WEIGHT DISTRIBUTIONS/SPECTRA
APPENDIX AA.5 – NORMALIZED AXLE WEIGHT STATISTICS FOR VEHICLE CLASSES 5 AND 9 FOR SELECTED SITES
APPENDIX AA.6 – NORMALIZED MONTHLY AXLE LOAD SPECTRA FOR FIVE SITES
APPENDIX AA.7 – DEFAULT NORMALIZED AXLE LOAD SPECTRA
APPENDIX AA.8 – NORMALIZED AXLE LOAD SPECTRA FOR LEVEL 1 INPUTS FOR THE EXAMPLE PROBLEMS
APPENDIX AA.9 – AXLE LOAD SPECTRA FROM OTHER ROADWAYS USED TO DETERMINE THE REGIONAL VALUES FOR THE LEVEL 2 AND LEVEL 3 INPUTS TO THE EXAMPLE PROBLEMS
APPENDIX AA.10 – REGIONAL AXLE LOAD SPECTRA USED FOR LEVEL 2 AND LEVEL 3 INPUTS TO THE EXAMPLE PROBLEMS
APPENDIX AA.11 – TABULATION OF A SUMMARY OF THE OUTPUT FROM THE TRAFFIC MODULE FOR THE EXAMPLE PROBLEMS
4
LIST OF TABLES
| Table 1. | List of information in Level 4 data and their corresponding column numbers | 19 |
| Table 2. | AVC temporary array for hourly data | 19 |
| Table 3. | WIM temporary array | 23 |
| Table 4. | LTPP Sections selected for initial traffic analysis | 24 |
| Table 5. | Traffic characteristics for Section 124103 | 26 |
| Table 6. | Time of day distribution | 35 |
| Table 7. | Truck traffic classification criteria | 40 |
| Table 8. | Number of sections from each TTC that fall into each functional class | 41 |
| Table 9. | Suggested guidance for selecting appointment TTCs for different highway | 41 |
| Table 10. | Definitions and descriptions for the truck traffic classifications | 42 |
| Table 11. | ρ and β used from the sigmoidal curve equation used to represent the cumulative percentage of the number of axles per weight group | 59 |
| Table 12. | ρ and β values determined for each of the default axle load spectra tabulated in Appendix G | 63 |
| Table 13. | Axle spacings from Level 4 WIM data, m | 65 |
| Table 14. | The tandem axle spacings for various percentiles of the data that were found from an analysis of the LTPP database for vehicle type 352000 | 66 |
| Table 15. | The average number of single, tandem, tridem axles per truck type | 66 |
| Table 16. | List of most commonly used tires and their share of the market | 67 |
| Table 17. | Tire widths and minimum dual spacings from TRA year book | 68 |
| Table 18. | Tire diameters from TRA yearbook | 68 |
| Table 19. | Tire diameters and widths for Bridgestone/Firestone tires | 68 |
| Table 20. | Maximum load and corresponding cold inflation pressures | 70 |
| Table 21. | Minimum sample size (number of days) to estimate the normalized axle load distribution – WIM data | 74 |
| Table 22. | Minimum sample size (number of days) to estimate the normalized vehicle class distribution – AVC data | 74 |
| Table 23. | Minimum sample size (number of days) to estimate the total axles per day by month or year – AVC data | 75 |
| Table 24. | Projected AADTT for the three example roadways | 78 |
| Table 25. | Representative normalized truck distribution spectra used for the example problems | 80 |
| Table 26. | Seasonal (monthly) distribution factors used for the example problems | 82 |
| Table 27. | Time of day distribution factors | 83 |
| Table 28a. | Truck directional and lane distribution factors from the region for Roadway A | 84 |
5
LIST OF TABLES (CONT.)
Table 28b. Truck directional and lane distribution factors from the region for Roadway B ....................................................................................................84
Table 28c. Truck directional and lane distribution factors from the region for Roadway C ....................................................................................................84
Table 29. Traffic characteristics for example problems ....................................................................................................85
Table 30a. Normalized truck distribution spectra from the region/state for Roadway A ....................................................................................................85
Table 30b. Normalized truck distribution spectra from the region/state for Roadway B ....................................................................................................85
Table 30c. Normalized truck distribution spectra from the region/state for Roadway C ....................................................................................................85
Table 31. Representative truck distribution spectrum for Roadways A, B and C ....................................................................................................86
Table 32a. Seasonal (monthly) distribution factors from the region for Roadway A ....................................................................................................89
Table 32b. Seasonal (monthly) distribution factors from the region for Roadway B ....................................................................................................89
Table 32c. Seasonal (monthly) distribution factors from the region for Roadway C ....................................................................................................90
Table 33a. Time of day distribution factors for Level 3 design for Roadways A ....................................................................................................92
Table 33b. Time of day distribution factors for Level 3 design for Roadways B ....................................................................................................93
Table 33c. Time of day distribution factors for Level 3 design for Roadways C ....................................................................................................93
Table 34. Traffic characteristics used for Level 4 inputs for example problems ....................................................................................................94
Table 35. Comparison of the differences among the levels of inputs for selected axle load groups using the average daily traffic ....................................................................................................96
Table 36. Number of 80kN Equivalent Single Axle Loads computed (using AASHTO load equivalency factors) for the first year for the four input levels for each example problem ....................................................................................................96
6
预览内容由文件识别整理,表格、公式及文字请以原始文件为准。
原文图片预览
PAGE IMAGES

下载标准文件
2appendices_AA
英语 · PDF · 6 页 · 22.06 MB