IEC 62066 Surge overvoltages and surge protection
低压交流电力系统中的浪涌过电压和浪涌保护 - 一般基础信息
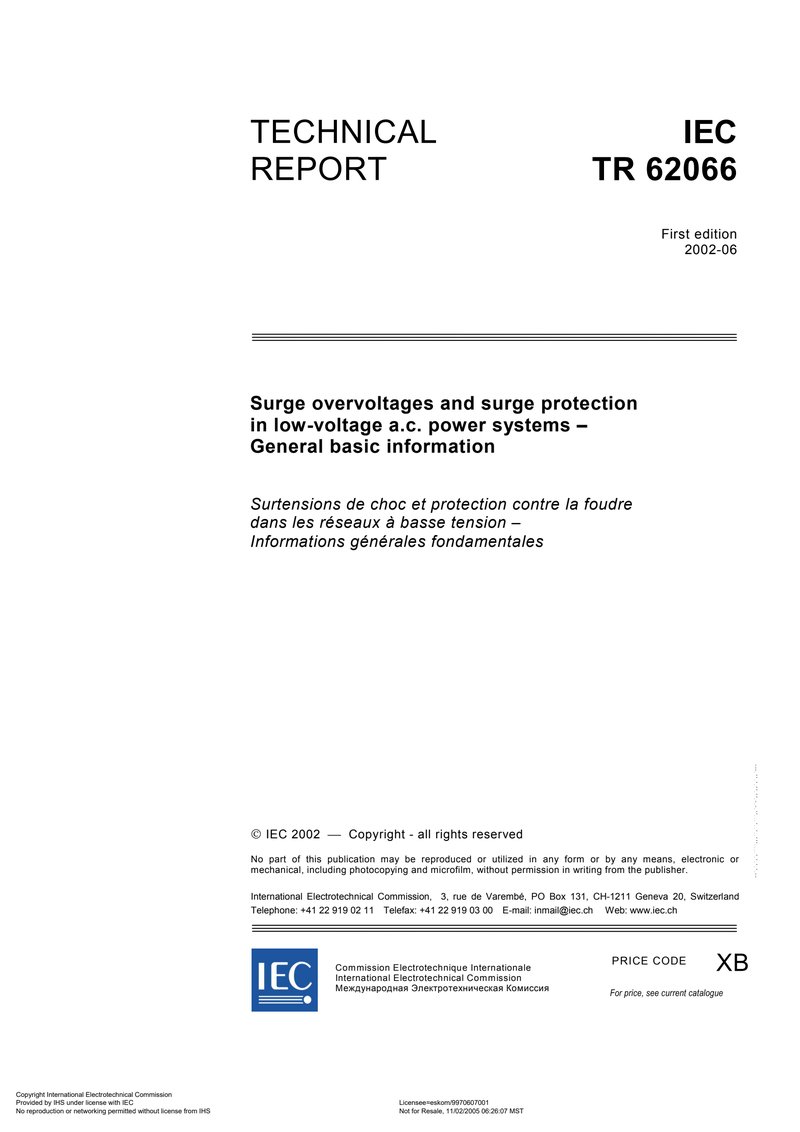
IEC 62066 Surge overvoltages and surge protection in low-voltage a.c. power systems – General basic information
Surge overvoltages and surge protection in low-voltage a.c. power systems – General basic information
标准信息
STANDARD INFORMATION- 标准编号
- IEC 62066 Surge overvoltages and surge protection
- 所属分类
- IEC 国际电工标准
- 发布机构
- IEC
- 版本年份
- 2002
- 文件语言
- 英语
- 文件格式
- 文件页数
- 6 页
- 文件大小
- 2.02 MB
中文名称为参考译名,文件语言以原文为准。
· 更新:
标准简介
OVERVIEW中文简介
该报告提供了低压交流电力系统中浪涌过电压(包括雷电、开关、暂态和系统相互作用过电压)的基础信息。它详细阐述了浪涌的起源、波形特征及在低压系统中的传播机制。此外,报告还讨论了浪涌保护设备(SPD)的选择、安装及协调配合,旨在为低压系统的浪涌保护设计提供指导。
English summary
This technical report provides general basic information on surge overvoltages and surge protection in low-voltage a.c. power systems. It covers the origins, characteristics, and propagation mechanisms of various surges, including lightning, switching, and temporary overvoltages. The document also discusses the selection, installation, and coordination of Surge Protective Devices (SPDs) to ensure effective protection for low-voltage systems.
以上为根据文件整理的内容简介。
相关标签
标准内容预览
DOCUMENT PREVIEWFigures
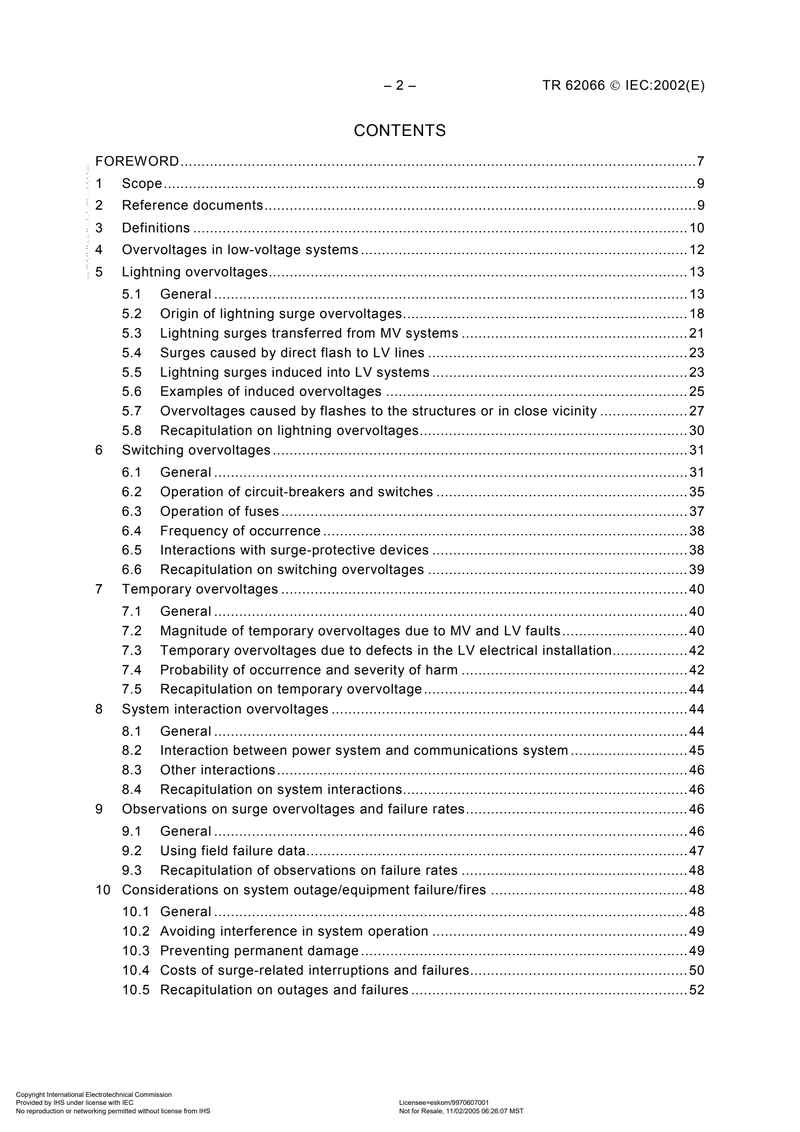
Figure 20 – Example of distribution of switching surge amplitudes measured in industrial distribution systems rated 230/400 V
Figure 21 – Switching surge during interruption by a miniature fuse [48]
Figure 22 – Distribution of the relative frequency of occurrence of switching surges at different installations
Figure 23 – PC/modem connections to the power system and to the communications system
Figure 24 – Example of diversion of lightning current into the external services (TT system)
Figure 25 – Considerations required for the selection of an SPD
Figure 26 – Effect of additional connecting lead on the limiting voltage of a varistor
Figure 27 – Basic model for energy coordination of SPDs
Figure A.1 – Frequency distribution of the lightning peak current Imax
Figure A.2 – Frequency distribution of the total lightning charge Qtotal
Figure A.3 – Frequency distribution of the transient lightning charge Qtrans
Figure A.4 – Frequency distribution of the specific lightning energy W/R
Figure A.5 – Frequency distribution of the maximum slope of transient current (di/dt)max
Figure A.6 – Frequency distribution of the slope of current (di/dt)30/90 % of negative subsequent strokes
Figure A.7 – Simplified example with lightning flash to overhead LV line
Figure A.8 – Prospective voltages between line and true earth at point of strike (node 1), at the transformer (node 2) and at the neutral conductor in the consumer installation (node 3)
Figure A.9 – Prospective voltages relative to true earth at node 3 and at node 4
Figure A.10 – Current to earth at the point of strike (node 1), at the transformer (node 2), and at the consumer installation (node 3)
Figure A.11 – Distribution of overvoltage peak magnitudes recorded at the primary of an MV/LV transformer
Figure A.12 – Circuit used for the statistical computation
Figure A.13 – Comparison of measured overvoltages [51] and computed overvoltages (Anastasia)
Figure A.14 – Model for computing dispersion of lightning current among parallel buildings (TN-C system) [24]
Figure A.15 – Dispersion of lightning current among the paths defined in figure A.14
Figure A.16 – Model for computing dispersion of lightning current among parallel buildings (TN-C system, Building 2 with no LPS and no SPDs at the service entrance) [24]
Figure A.17 – Currents and voltage for the example of figure A.16
Figure B.1 – Example illustrating transient resonance caused by switching
Figure B.2 – Calculated overvoltages at the circuit nodes of figure B.1
Figure B.3 – Typical overvoltage occurring during capacitor bank energizing
Figure B.4a – Magnification condition
Figure B.4b – Voltage magnification effect
Figure B.4 – Magnification of capacitor switching overvoltage at remote bank
Figure B.5 – Principle of overvoltage generated by clearing a short-circuit
Figure B.6 – Example of survey of switching overvoltages in three types of installations
Figure B.7 – Switching surges in an industrial plant measured near the collecting bar
Figure B.8 – Frequency of occurrence at selected sites and overall results
Figure B.9 – Test circuit and surge during trip of a miniature breaker due to inrush overload
Figure B.10 – Example of overvoltage at the secondary collecting bar of a 230/400 V transformer substation when blowing 100 A fuses of a feeder
6
Révision de la présente publication
Le contenu technique des publications de la CEI est constamment revu par la Commission afin d'assurer qu'il reflète bien l'état actuel de la technique.
Les renseignements relatifs à ce travail de révision, à l'établissement des éditions révisées et aux mises à jour peuvent être obtenus auprès des Comités nationaux de la CEI et en consultant les documents ci-dessous :
- Bulletin de la CEI
- Annuaire de la CEI
- Catalogue des publications de la CEI
Publié annuellement
Terminologie
En ce qui concerne la terminologie générale, le lecteur se reportera à la Publication 50 de la CEI : Vocabulaire Electrotechnique International (VEI), qui est établie sous forme de chapitres séparés traitant chacun d'un sujet défini, l'Index général étant publié séparément. Des détails complets sur le VEI peuvent être obtenus sur demande.
Les termes et définitions figurant dans la présente publication ont été soit repris du VEI, soit spécifiquement approuvés aux fins de cette publication.
Symboles graphiques et littéraux
Pour les symboles graphiques, symboles littéraux et signes d'usage général approuvés par la CEI, le lecteur consultera :
- la Publication 27 de la CEI : Symboles littéraux à utiliser en électrotechnique ;
- la Publication 617 de la CEI : Symboles graphiques pour schémas.
Les symboles et signes contenus dans la présente publication ont été soit repris des Publications 27 ou 617 de la CEI, soit spécifiquement approuvés aux fins de cette publication.
Publications de la CEI établies par le même Comité d'Etudes
L'attention du lecteur est attirée sur la page 3 de la couverture, qui énumère les publications de la CEI préparées par le Comité d'Etudes qui a établi la présente publication.
Revision of this publication
The technical content of IEC publications is kept under constant review by the IEC, thus ensuring that the content reflects current technology.
Information on the work of revision, the issue of revised editions and amendment sheets may be obtained from IEC National Committees and from the following IEC sources :
- IEC Bulletin
- IEC Yearbook
- Catalogue of IEC Publications
Published yearly
Terminology
For general terminology, readers are referred to IEC Publication 50 : International Electrotechnical Vocabulary (IEV), which is issued in the form of separate chapters each dealing with a specific field, the General Index being published as a separate booklet. Full details of the IEV will be supplied on request.
The terms and definitions contained in the present publication have either been taken from the IEV or have been specifically approved for the purpose of this publication.
Graphical and letter symbols
For graphical symbols, and letter symbols and signs approved by the IEC for general use, readers are referred to :
- IEC Publication 27 : Letter symbols to be used in electrical technology ;
- IEC Publication 617 : Graphical symbols for diagrams.
The symbols and signs contained in the present publication have either been taken from IEC Publications 27 or 617, or have been specifically approved for the purpose of this publication.
IEC publications prepared by the same Technical Committee
The attention of readers is drawn to the inside of the back cover, which lists IEC publications issued by the Technical Committee which has prepared the present publication.
2
NORME INTERNATIONALE INTERNATIONAL STANDARD МЕЖДУНАРОДНЫЙ СТАНДАРТ
|
NORME INTERNATIONALE INTERNATIONAL STANDARD МЕЖДУНАРОДНЫЙ СТАНДАРТ |
CEI IEC 50(426) Première édition First edition 1990-10 Vocabulaire Electrotechnique InternationalChapitre 426 : Matériel électrique pour atmosphères explosives International Electrotechnical VocabularyChapter 426 : Electrical apparatus for explosive atmospheres Международный Электротехнический СловарьГлава 426 : Электрооборудование для взрывоопасных сред © CEI 1990 Droits de reproduction réservés - Copyright - all rights reserved - Право издания охраняется законом Aucune partie de cette publication ne peut être reproduite ni utilisée sous quelque forme que ce soit et par aucun procédé, électronique ou mécanique, y compris la photocopie et les microfilms, sans l'accord écrit de l'éditeur. No part of this publication may be reproduced or utilized in any form or by any means, electronic or mechanical, including photocopying and microfilm, without permission in writing from the publisher. Запрещается Без письменного разрешения издателя воспроизведение или копирование этой публикации или ее части в любой форме или любыми средствами — электронными или механическими, включая фотоконю и микрофильм. Bureau central de la Commission Electrotechnique Internationale 3, rue de Varembé Genève Suisse
|
50(715) © IEC:1996
CONTENTS
| FOREWORD | VII | |
| PREFACE | VII | |
| Sections | ||
| 715-01 | Basic terms | 1 |
| 715-02 | Resources | 10 |
| 715-03 | Calls | 17 |
| 715-04 | Times and delays | 22 |
| 715-05 | Traffic | 24 |
| 715-06 | Circuit groups | 32 |
| 715-07 | Traffic engineering | 34 |
| 715-08 | Networks | 41 |
| 715-09 | Circuit switched networks | 46 |
| 715-10 | Message switched networks | 51 |
| 715-11 | Packet switched networks | 52 |
| Index | 53 |
:current
Foreword
This document (EN 10216-3:2002) has been prepared by Technical Committee EC/TC 29, "Steel tubes and fittings for steel tubes", the secretariat of which is held by UNI.
This European Standard shall be given the status of a national standard, either by publication of an identical text or by endorsement, at the latest by November 2002, and conflicting national standards shall be withdrawn at the latest by November 2002.
This document has been prepared under a mandate given to CEN by the European Commission and the European Free Trade Association, and supports essential requirements of EU Directive(s).
For relationship with EU Directive(s), see informative annex ZA, which is an integral part of this document.
Other Parts of EN 10216 are:
| Part 1: | Non-alloy steel tubes with specified room temperature properties |
| Part 2: | Non-alloy and alloy steel tubes with specified elevated temperature properties |
| Part 4: | Non-alloy and alloy steel tubes with specified low temperature properties |
| Part 5: | Stainless steel tubes |
Another European Standard series covering tubes for pressure purposes is:
| EN 10217: | Welded steel tubes for pressure purposes |
According to the CEN/CENELEC Internal Regulations, the national standards organizations of the following countries are bound to implement this European Standard: Austria, Belgium, Czech Republic, Denmark, Finland, France, Germany, Greece, Iceland, Ireland, Italy, Luxembourg, Malta, Netherlands, Norway, Portugal, Spain, Sweden, Switzerland and the United Kingdom.
5
1 Scope
This Part of EN 10216 specifies the technical delivery conditions in two test categories for seamless tubes of circular cross section, made of weldable alloyed fine grained steel.
2 Normative references
This European Standard incorporates by date or undated reference, provisions from other publications. These normative references are cited at the appropriate places in the text and the publications are listed hereafter. For date references, subsequent amendments to or revisions of, any of these publications apply to this European Standard only when incorporated in it by amendment or revision. For undated references the latest edition of the publication referred to applies (including amendments).
The requirements of this European Standard rule when they differ from those in the standards and documents referred to below:
EN 10002-1, Metallic materials - Tensile testing - Part 1: Method of test (at ambient temperature).
EN 10002-5, Metallic materials - Tensile testing - Part 5: Method of testing (at elevated temperature).
EN 10020, Definitions and classification of grades of steel.
EN 10021, General technical delivery requirements for steel and iron products.
EN 10045-1, Metallic materials - Charpy impact test - Part 1: Test method.
EN 10052, Vocabulary of heat treatment terms for ferrous products.
EN 10204, Metallic products - Types of inspection documents.
EN 10027-1, Designation systems for steels - Part 1: Steel names, principle symbols.
EN 10027-2, Designation systems for steels Part 2: Numerical systems.
ENV 10220, Seamless and welded steel tubes - Dimensions and masses per unit length
EN 10233, Metallic materials - Tubes - Flattening test.
EN 10234, Metallic materials - Tubes - Drift expanding test.
EN 10236, Metallic materials - Tubes - Ring expanding test.
EN 10237, Metallic materials - Tubes - Ring tensile test.
EN 10246-1, Non-Destructive Testing of steel tubes Part 1: Automatic electromagnetic testing of seamless and welded (except submerged arc welded) ferromagnetic steel tubes for verification of hydraulic leak-tightness.
EN 10246-5, Non-Destructive Testing of steel tubes - Part 5: Automatic full peripheral magnetic transducer/flux leakage testing of seamless and welded (except submerged arc-welded) ferromagnetic steel tubes for the detection of longitudinal imperfections.
EN 10246-6, Non-Destructive Testing of steel tubes - Part 6: Automatic full peripheral ultrasonic testing of seamless steel tubes for the detection of transverse imperfections.
EN 10246-7, Non-Destructive Testing of steel tubes - Part 7: Automatic full peripheral ultrasonic testing of seamless and welded (except submerged arc welded) steel tubes for the detection of longitudinal imperfections.
6
预览内容由文件识别整理,表格、公式及文字请以原始文件为准。
原文图片预览
PAGE IMAGES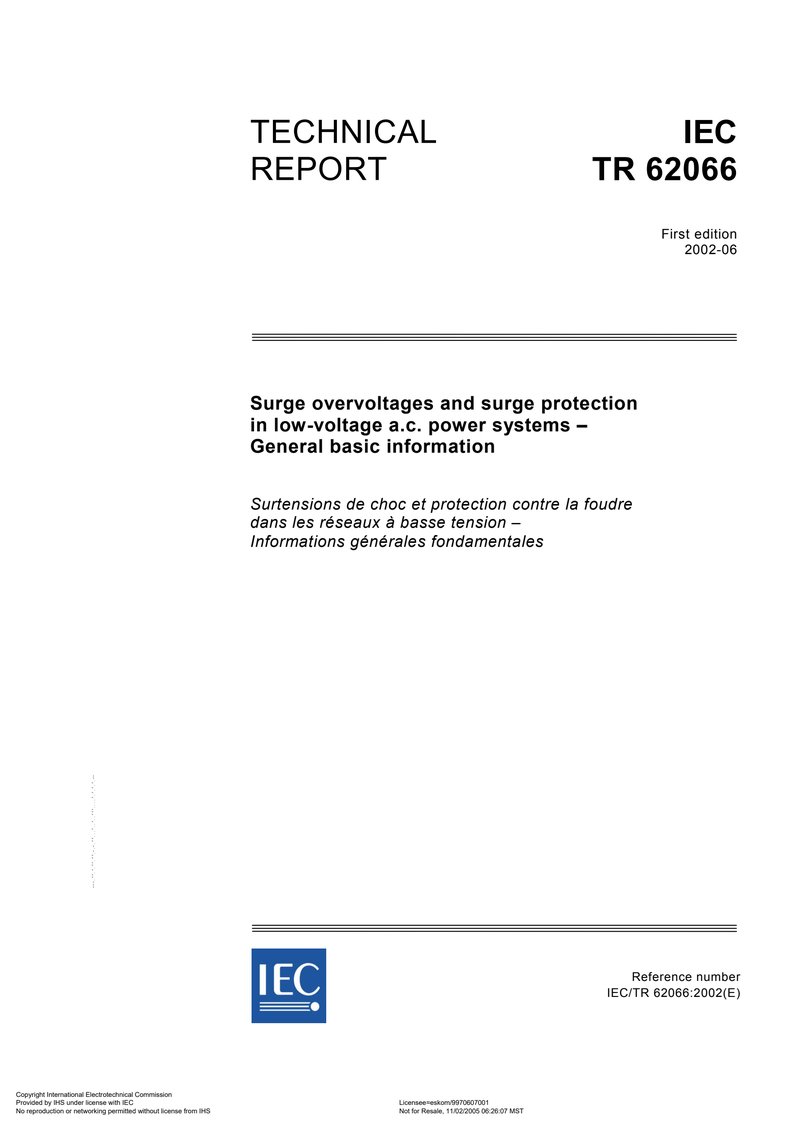
下载标准文件
IEC 62066 Surge overvoltages and surge protection
英语 · PDF · 6 页 · 2.02 MB