ACI 214-77
混凝土强度试验结果评定推荐规程
ACI 214-77
Recommended Practice for Evaluation of Strength Test Results of Concrete
标准信息
STANDARD INFORMATION- 标准编号
- ACI 214-77
- 所属分类
- ACI 美国混凝土学会标准
- 发布机构
- American Concrete Institute (ACI)
- 版本年份
- 1997
- 文件语言
- 英语
- 文件格式
- 文件页数
- 6 页
- 文件大小
- 408.11 KB
中文名称为参考译名,文件语言以原文为准。
· 更新:
标准简介
OVERVIEW中文简介
该标准介绍用于评定混凝土强度试验结果的统计方法,帮助判断混凝土是否符合强度规范并评估其变异性。它适用于混凝土生产、质量控制、取样、抗压强度试验以及强度数据的统计分析。
English summary
This recommended practice describes statistical procedures for evaluating concrete strength test results, assessing compliance with strength specifications, and measuring concrete variability. It applies to concrete production, quality control, sampling, compression testing, and interpretation of strength data.
以上为根据文件整理的内容简介。
相关标签
标准内容预览
DOCUMENT PREVIEWThe batch-to-batch and within-test sources of variation are related to the overall variation [Eq. (3-3)] by the following expression:
σ2 = σ12 + σ22 (3-6)
where
σ = overall standard deviation
σ1 = within-test standard deviation
σ2 = batch-to-batch standard deviation
Once these parameters have been computed, and with the assumption that the results follow a normal frequency distribution curve, a large amount of information about the test results becomes known. Fig. 3.4.2 (a) indicates an approximate division of the area under the normal frequency distribution curve. For example, approximately 68 percent of the area (equivalent to 68 percent of the test results) lies within ±1σ of the average, 95 percent within ±2σ, etc. This permits an estimate to be made of the portion of
Fig. 3.4.2(b)-Cumulative distribution curves for different coefficients of variation
| Average strength, X̄ | Expected percentage of low tests | Average strength, X̄ | Expected percentage of low tests |
|---|---|---|---|
| fc' + 0.10σ | 46.0 | fc' + 1.6σ | 5.5 |
| fc' + 0.20σ | 42.1 | fc' + 1.7σ | 4.5 |
| fc' + 0.30σ | 38.2 | fc' + 1.8σ | 3.6 |
| fc' + 0.40σ | 34.5 | fc' + 1.9σ | 2.9 |
| fc' + 0.50σ | 30.9 | fc' + 2.0σ | 2.3 |
| fc' + 0.60σ | 27.4 | fc' + 2.1σ | 1.8 |
| fc' + 0.70σ | 24.2 | fc' + 2.2σ | 1.4 |
| fc' + 0.80σ | 21.2 | fc' + 2.3σ | 1.1 |
| fc' + 0.90 | 18.4 | fc' + 2.4σ | 0.8 |
| fc' + σ | 15.9 | fc' + 2.5σ | 0.6 |
| fc' + 1.10σ | 13.6 | fc' + 2.6σ | 0.45 |
| fc' + 1.20σ | 11.5 | fc' + 2.7σ | 0.35 |
| fc' + 1.30σ | 9.7 | fc' + 2.8σ | 0.25 |
| fc' + 1.40σ | 8.1 | fc' + 2.9σ | 0.19 |
| fc' + 1.50 | 6.7 | fc' + 3.0 | 0.13 |
Fig. 3.4.2(c)-Cumulative distribution curves for different standard deviations
6
CHAPTER 1-INTRODUCTION
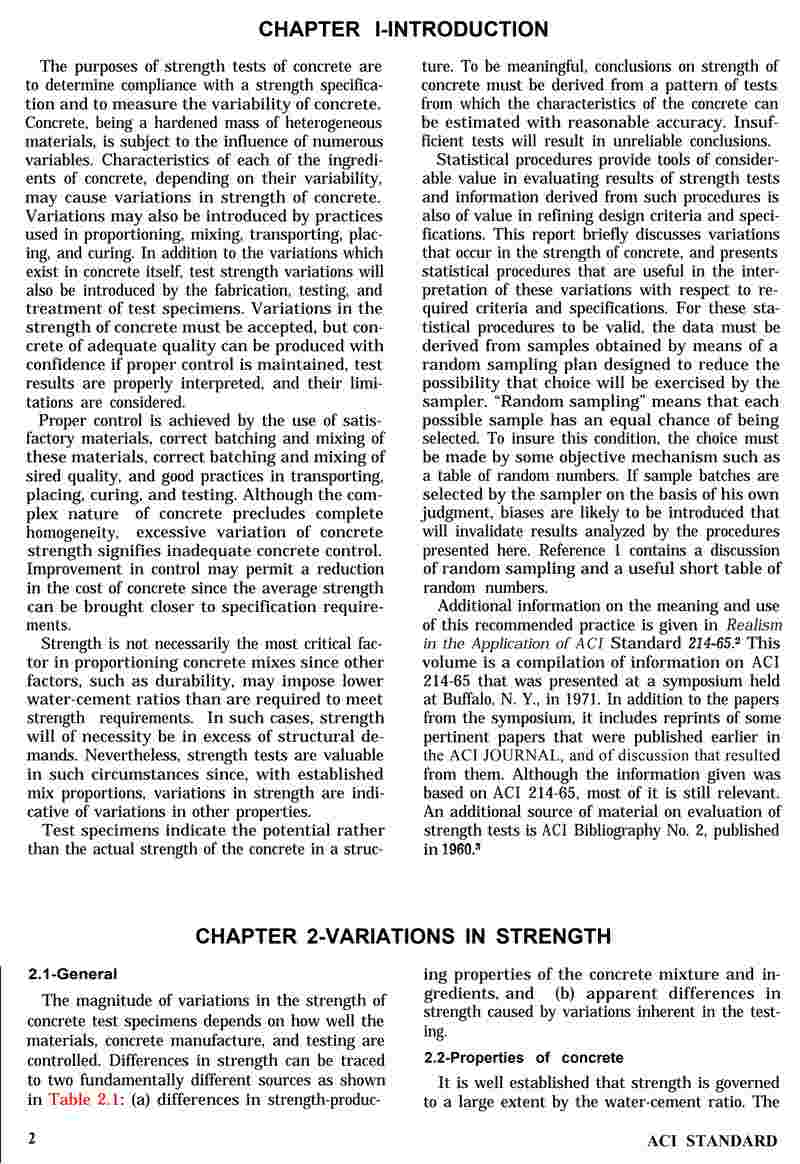
The purposes of strength tests of concrete are to determine compliance with a strength specification and to measure the variability of concrete. Concrete, being a hardened mass of heterogeneous materials, is subject to the influence of numerous variables. Characteristics of each of the ingredients of concrete, depending on their variability, may cause variations in strength of concrete. Variations may also be introduced by practices used in proportioning, mixing, transporting, placing, and curing. In addition to the variations which exist in concrete itself, test strength variations will also be introduced by the fabrication, testing, and treatment of test specimens. Variations in the strength of concrete must be accepted, but concrete of adequate quality can be produced with confidence if proper control is maintained, test results are properly interpreted, and their limitations are considered.
Proper control is achieved by the use of satisfactory materials, correct batching and mixing of these materials, correct batching and mixing of sired quality, and good practices in transporting, placing, curing, and testing. Although the complex nature of concrete precludes complete homogeneity, excessive variation of concrete strength signifies inadequate concrete control. Improvement in control may permit a reduction in the cost of concrete since the average strength can be brought closer to specification requirements.
Strength is not necessarily the most critical factor in proportioning concrete mixes since other factors, such as durability, may impose lower water-cement ratios than are required to meet strength requirements. In such cases, strength will of necessity be in excess of structural demands. Nevertheless, strength tests are valuable in such circumstances since, with established mix proportions, variations in strength are indicative of variations in other properties.
Test specimens indicate the potential rather than the actual strength of the concrete in a structure. To be meaningful, conclusions on strength of concrete must be derived from a pattern of tests from which the characteristics of the concrete can be estimated with reasonable accuracy. Insufficient tests will result in unreliable conclusions.
Statistical procedures provide tools of considerable value in evaluating results of strength tests and information derived from such procedures is also of value in refining design criteria and specifications. This report briefly discusses variations that occur in the strength of concrete, and presents statistical procedures that are useful in the interpretation of these variations with respect to required criteria and specifications. For these statistical procedures to be valid, the data must be derived from samples obtained by means of a random sampling plan designed to reduce the possibility that choice will be exercised by the sampler. "Random sampling" means that each possible sample has an equal chance of being selected. To insure this condition, the choice must be made by some objective mechanism such as a table of random numbers. If sample batches are selected by the sampler on the basis of his own judgment, biases are likely to be introduced that will invalidate results analyzed by the procedures presented here. Reference 1 contains a discussion of random sampling and a useful short table of random numbers.
Additional information on the meaning and use of this recommended practice is given in Realism in the Application of ACI Standard 214-65.3 This volume is a compilation of information on ACI 214-65 that was presented at a symposium held at Buffalo, N. Y., in 1971. In addition to the papers from the symposium, it includes reprints of some pertinent papers that were published earlier in the ACI JOURNAL, and of discussion that resulted from them. Although the information given was based on ACI 214-65, most of it is still relevant. An additional source of material on evaluation of strength tests is ACI Bibliography No. 2, published in 1960.3
CHAPTER 2-VARIATIONS IN STRENGTH
2.1-General
The magnitude of variations in the strength of concrete test specimens depends on how well the materials, concrete manufacture, and testing are controlled. Differences in strength can be traced to two fundamentally different sources as shown in Table 2.1: (a) differences in strength-producing properties of the concrete mixture and ingredients, and (b) apparent differences in strength caused by variations inherent in the testing.
2.2-Properties of concrete
It is well established that strength is governed to a large extent by the water-cement ratio. The
2
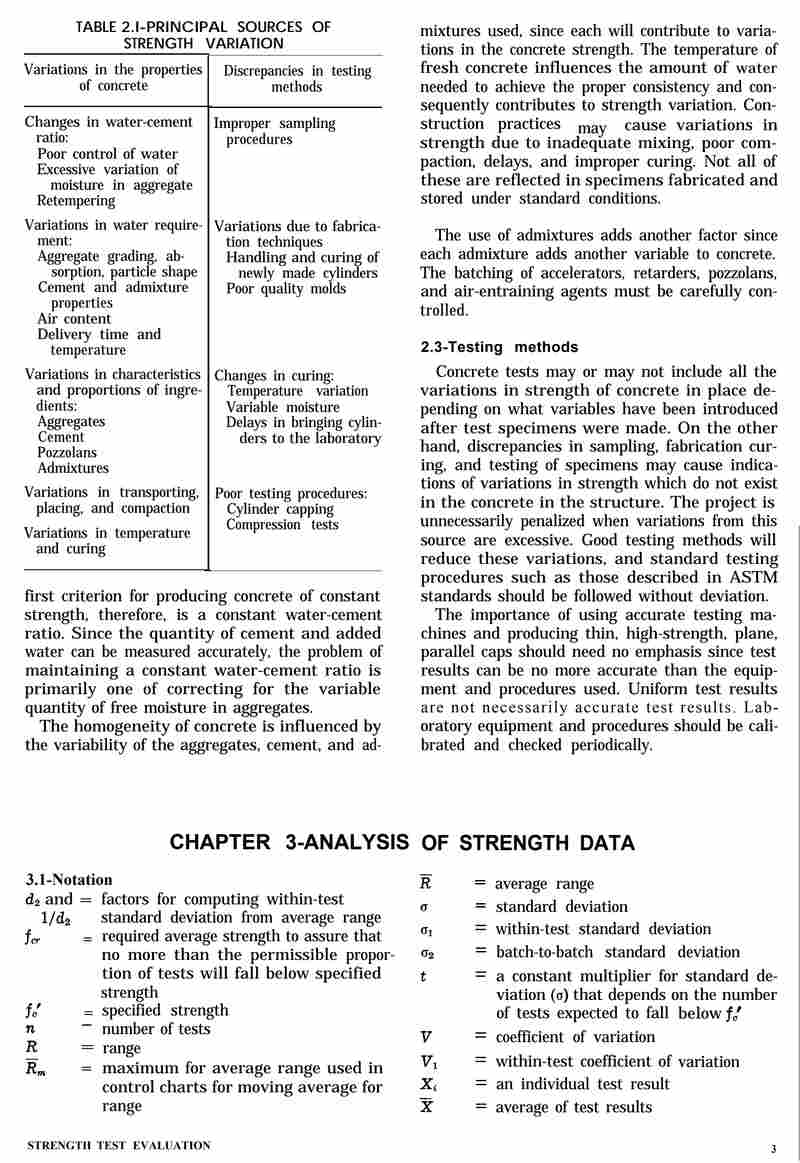
| Variations in the properties of concrete | Discrepancies in testing methods |
|---|---|
| Changes in water-cement ratio: Poor control of water Excessive variation of moisture in aggregate Retempering |
Improper sampling procedures |
| Variations in water requirement: Aggregate grading, absorption, particle shape Cement and admixture properties Air content Delivery time and temperature |
Variations due to fabrication techniques Handling and curing of newly made cylinders Poor quality molds |
| Variations in characteristics and proportions of ingredients: Aggregates Cement Pozzolans Admixtures |
Changes in curing: Temperature variation Variable moisture Delays in bringing cylinders to the laboratory |
| Variations in transporting, placing, and compaction Variations in temperature and curing |
Poor testing procedures: Cylinder capping Compression tests |
first criterion for producing concrete of constant strength, therefore, is a constant water-cement ratio. Since the quantity of cement and added water can be measured accurately, the problem of maintaining a constant water-cement ratio is primarily one of correcting for the variable quantity of free moisture in aggregates.
The homogeneity of concrete is influenced by the variability of the aggregates, cement, and admixtures used, since each will contribute to variations in the concrete strength. The temperature of fresh concrete influences the amount of water needed to achieve the proper consistency and consequently contributes to strength variation. Construction practices may cause variations in strength due to inadequate mixing, poor compaction, delays, and improper curing. Not all of these are reflected in specimens fabricated and stored under standard conditions.
The use of admixtures adds another factor since each admixture adds another variable to concrete. The batching of accelerators, retarders, pozzolans, and air-entraining agents must be carefully controlled.
2.3-Testing methods
Concrete tests may or may not include all the variations in strength of concrete in place depending on what variables have been introduced after test specimens were made. On the other hand, discrepancies in sampling, fabrication curing, and testing of specimens may cause indications of variations in strength which do not exist in the concrete in the structure. The project is unnecessarily penalized when variations from this source are excessive. Good testing methods will reduce these variations, and standard testing procedures such as those described in ASTM standards should be followed without deviation.
The importance of using accurate testing machines and producing thin, high-strength, plane, parallel caps should need no emphasis since test results can be no more accurate than the equipment and procedures used. Uniform test results are not necessarily accurate test results. Laboratory equipment and procedures should be calibrated and checked periodically.
CHAPTER 3-ANALYSIS OF STRENGTH DATA
3.1-Notation
|
d2 and = factors for computing within-test standard deviation from average range fcr = required average strength to assure that no more than the permissible proportion of tests will fall below specified strength f'c = specified strength n = number of tests R = range Rm = maximum for average range used in control charts for moving average for range |
R̄ = average range σ = standard deviation σ1 = within-test standard deviation σ2 = batch-to-batch standard deviation t = a constant multiplier for standard deviation (σ) that depends on the number of tests expected to fall below f'c V = coefficient of variation V1 = within-test coefficient of variation Xi = an individual test result X̄ = average of test results |
3
Fig. 3.3(a)-Frequency distribution of strength data and corresponding normal distribution
3.2-GeneralTo obtain maximum information, a sufficient number of tests should be made to indicate the variation in the concrete produced and to permit appropriate statistical procedures to be used in interpreting the test results. Statistical procedures provide the best basis for determining from such results the potential quality and strength of the concrete and for expressing results in the most useful form. Fig. 3.3(b)-Normal frequency curves for different standard deviations |
3.3-Statistical functionsThe strength of concrete test specimens on controlled projects can be assumed to fall "into a pattern similar to the normal frequency distribution curve illustrated in Fig. 3.3 (a). Where there is good control, the strength values will be bunched close to the average, and the curve will be tall and narrow. As the variations in strength increase, the values spread- and the curve becomes low and elongated, as illustrated by the idealized curves shown in Fig. 3.3 (b). Because the characteristics of such curves can be defined mathematically, certain useful functions of the strength can be calculated as follows: 3.3.1 Average, X̄—The average strength of all individual tests X̄ = (X1 + X2 + X3 + ... + Xn) / n (3-1) Where X1, X2, X3... Xn are the strength results of individual tests and n is the total number of tests made. A test is defined as the average strength of all specimens of the same age fabricated from a sample taken from a single batch of concrete. 3.3.2 Standard deviation, σ—The most generally recognized measure of dispersion is the root-mean-square deviation of the strengths from their average. This statistic is known as the standard deviation and may be considered to be the radius of gyration about the line of symmetry of the |
4
|
area under the curve of the frequency distribution of strength data, such as that shown in Fig. 3.3 (a). The best estimate of σ, based on a finite amount of data, is obtained by Eq. (3-2) or by its algebraic equivalent, Eq. (3-2a). The latter equation is preferable for computation purposes, because it is not only simpler and more adaptable to desk calculators, but it avoids the possibility of trouble due to rounding errors. σ = {(X1 − X̄)2 + (X2 − X̄)2 + ... + (Xn − X̄)2/n − 1}½ (3-2) or σ = √(ΣXi2 − (ΣXi)2/n − 1) (3-2a) 3.3.3 Coefficient of variation, VThe standard deviation expressed as a percentage of the average strength is called the coefficient of variation: V = σ/X̄ × 100 (3-3) 3.3.4 Range, RRange is the statistic found by subtracting the lowest of a group of numbers from the highest one in the group. The within-test range is found by subtracting the lowest of the group of cylinder strengths averaged to produce a test from the highest of the group. The within-test range is useful in computing the within-test standard deviation discussed in the following section. 3.4 Strength variationsAs mentioned previously, variations in results of strength tests can be traced to two different sources: (a) variations in testing methods and (b) properties of the concrete mixture and ingredients. It is possible by analysis of variance to compute the variations attributable to each source. 3.4.1 Within-test variationThe variation in strength of concrete within a single test is found by computing the variation of a group of cylinders fabricated from a sample of concrete taken from a given batch. It is reasonable to assume that a test sample of concrete is homogeneous and any variation between companion cylinders fabricated from a given sample is caused by fabricating, curing, and testing variations. A single batch of concrete, however, provides insufficient data for statistical analysis and companion cylinders from at least ten batches of con- |
*From Table B2, ASTM Manual on Quality Control of Materials, Reference 4. crete are required to establish reliable values for R̄. The within-test standard deviation and coefficient of variation can be conveniently computed as follows: σ1 = 1/d2 R̄ (3-4) V1 = σ1/X̄ × 100 (3-5) where σ1 = within-test standard deviation 1/d2 = a constant depending on the number of cylinders averaged to produce a test (Table 3.4.1) R̄ = average range within groups of companion cylinders V1 = within-test coefficient of variation X̄ = average strength 3.4.2 Batch-to-batch variationsThese |
The batch-to-batch and within-test sources of variation are related to the overall variation [Eq. (3-3)] by the following expression:
σ2 = σ12 + σ22 (3-6)
where
σ = overall standard deviation
σ1 = within-test standard deviation
σ2 = batch-to-batch standard deviation
Once these parameters have been computed, and with the assumption that the results follow a normal frequency distribution curve, a large amount of information about the test results becomes known. Fig. 3.4.2 (a) indicates an approximate division of the area under the normal frequency distribution curve. For example, approximately 68 percent of the area (equivalent to 68 percent of the test results) lies within ±1σ of the average, 95 percent within ±2σ, etc. This permits an estimate to be made of the portion of
Fig. 3.4.2(b)-Cumulative distribution curves for different coefficients of variation
| Average strength, X̄ | Expected percentage of low tests | Average strength, X̄ | Expected percentage of low tests |
|---|---|---|---|
| fc' + 0.10σ | 46.0 | fc' + 1.6σ | 5.5 |
| fc' + 0.20σ | 42.1 | fc' + 1.7σ | 4.5 |
| fc' + 0.30σ | 38.2 | fc' + 1.8σ | 3.6 |
| fc' + 0.40σ | 34.5 | fc' + 1.9σ | 2.9 |
| fc' + 0.50σ | 30.9 | fc' + 2.0σ | 2.3 |
| fc' + 0.60σ | 27.4 | fc' + 2.1σ | 1.8 |
| fc' + 0.70σ | 24.2 | fc' + 2.2σ | 1.4 |
| fc' + 0.80σ | 21.2 | fc' + 2.3σ | 1.1 |
| fc' + 0.90 | 18.4 | fc' + 2.4σ | 0.8 |
| fc' + σ | 15.9 | fc' + 2.5σ | 0.6 |
| fc' + 1.10σ | 13.6 | fc' + 2.6σ | 0.45 |
| fc' + 1.20σ | 11.5 | fc' + 2.7σ | 0.35 |
| fc' + 1.30σ | 9.7 | fc' + 2.8σ | 0.25 |
| fc' + 1.40σ | 8.1 | fc' + 2.9σ | 0.19 |
| fc' + 1.50 | 6.7 | fc' + 3.0 | 0.13 |
Fig. 3.4.2(c)-Cumulative distribution curves for different standard deviations
6
预览内容由文件识别整理,表格、公式及文字请以原始文件为准。
原文图片预览
PAGE IMAGES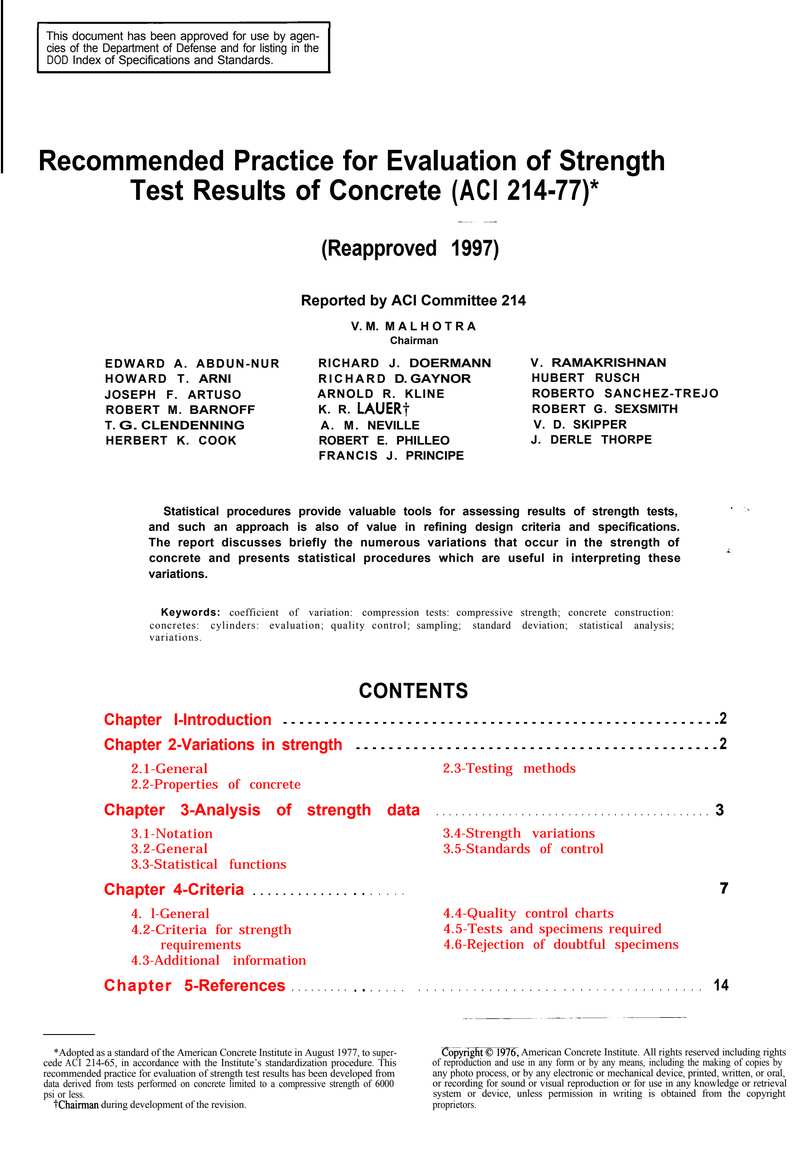

下载标准文件
ACI 214-77
英语 · PDF · 6 页 · 408.11 KB